 DCF-现金流贴现模型-Excel模版(dcf-估值模型).xlsx
- 文档编号:899930
- 上传时间:2023-04-30
- 格式:XLSX
- 页数:3
- 大小:58.77KB
DCF-现金流贴现模型-Excel模版(dcf-估值模型).xlsx
《DCF-现金流贴现模型-Excel模版(dcf-估值模型).xlsx》由会员分享,可在线阅读,更多相关《DCF-现金流贴现模型-Excel模版(dcf-估值模型).xlsx(3页珍藏版)》请在冰点文库上搜索。
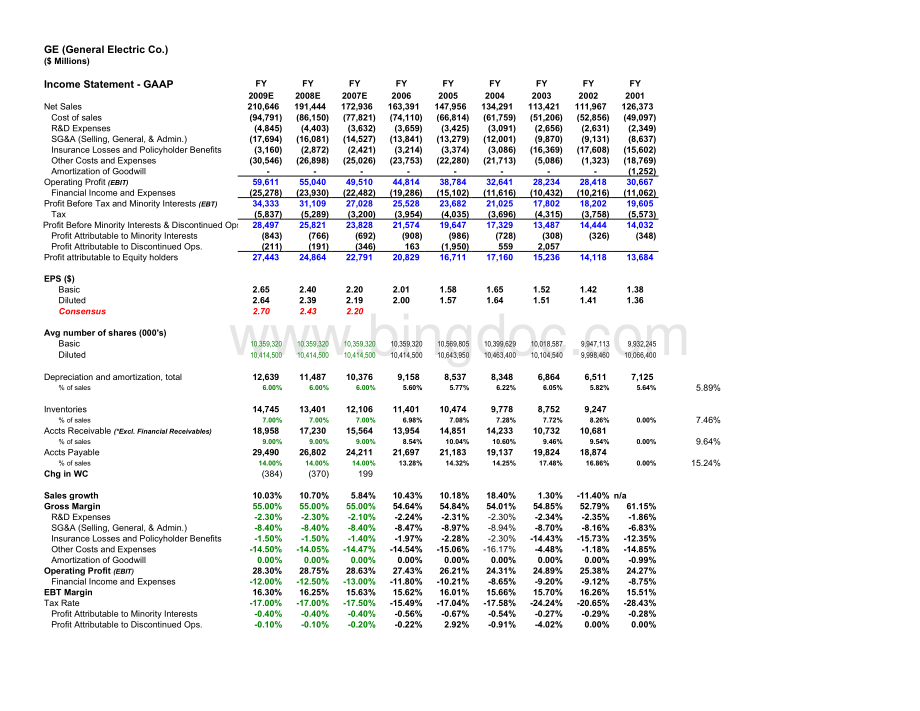
GE(GeneralElectricCo.)($Millions)IncomeStatement-GAAPFYFYFYFYFYFYFYFYFY2009E2008E2007E200620052004200320022001NetSales210,646191,444172,936163,391147,956134,291113,421111,967126,373Costofsales(94,791)(86,150)(77,821)(74,110)(66,814)(61,759)(51,206)(52,856)(49,097)R&DExpenses(4,845)(4,403)(3,632)(3,659)(3,425)(3,091)(2,656)(2,631)(2,349)SG&A(Selling,General,&Admin.)(17,694)(16,081)(14,527)(13,841)(13,279)(12,001)(9,870)(9,131)(8,637)InsuranceLossesandPolicyholderBenefits(3,160)(2,872)(2,421)(3,214)(3,374)(3,086)(16,369)(17,608)(15,602)OtherCostsandExpenses(30,546)(26,898)(25,026)(23,753)(22,280)(21,713)(5,086)(1,323)(18,769)AmortizationofGoodwill-(1,252)OperatingProfit(EBIT)59,61155,04049,51044,81438,78432,64128,23428,41830,667FinancialIncomeandExpenses(25,278)(23,930)(22,482)(19,286)(15,102)(11,616)(10,432)(10,216)(11,062)ProfitBeforeTaxandMinorityInterests(EBT)34,33331,10927,02825,52823,68221,02517,80218,20219,605Tax(5,837)(5,289)(3,200)(3,954)(4,035)(3,696)(4,315)(3,758)(5,573)ProfitBeforeMinorityInterests&DiscontinuedOps.28,49725,82123,82821,57419,64717,32913,48714,44414,032ProfitAttributabletoMinorityInterests(843)(766)(692)(908)(986)(728)(308)(326)(348)ProfitAttributabletoDiscontinuedOps.(211)(191)(346)163(1,950)5592,057ProfitattributabletoEquityholders27,44324,86422,79120,82916,71117,16015,23614,11813,684EPS($)Basic2.652.402.202.011.581.651.521.421.38Diluted2.642.392.192.001.571.641.511.411.36Consensus2.702.432.20Avgnumberofshares(000s)Basic10,359,32010,359,32010,359,32010,359,32010,569,80510,399,62910,018,5879,947,1139,932,245Diluted10,414,50010,414,50010,414,50010,414,50010,643,95010,463,40010,104,5409,998,46010,066,400Depreciationandamortization,total12,63911,48710,3769,1588,5378,3486,8646,5117,125%ofsales6.00%6.00%6.00%5.60%5.77%6.22%6.05%5.82%5.64%5.89%Inventories14,74513,40112,10611,40110,4749,7788,7529,247%ofsales7.00%7.00%7.00%6.98%7.08%7.28%7.72%8.26%0.00%7.46%AcctsReceivable(*Excl.FinancialReceivables)18,95817,23015,56413,95414,85114,23310,73210,681%ofsales9.00%9.00%9.00%8.54%10.04%10.60%9.46%9.54%0.00%9.64%AcctsPayable29,49026,80224,21121,69721,18319,13719,82418,874%ofsales14.00%14.00%14.00%13.28%14.32%14.25%17.48%16.86%0.00%15.24%ChginWC(384)(370)199Salesgrowth10.03%10.70%5.84%10.43%10.18%18.40%1.30%-11.40%n/aGrossMargin55.00%55.00%55.00%54.64%54.84%54.01%54.85%52.79%61.15%R&DExpenses-2.30%-2.30%-2.10%-2.24%-2.31%-2.30%-2.34%-2.35%-1.86%SG&A(Selling,General,&Admin.)-8.40%-8.40%-8.40%-8.47%-8.97%-8.94%-8.70%-8.16%-6.83%InsuranceLossesandPolicyholderBenefits-1.50%-1.50%-1.40%-1.97%-2.28%-2.30%-14.43%-15.73%-12.35%OtherCostsandExpenses-14.50%-14.05%-14.47%-14.54%-15.06%-16.17%-4.48%-1.18%-14.85%AmortizationofGoodwill0.00%0.00%0.00%0.00%0.00%0.00%0.00%0.00%-0.99%OperatingProfit(EBIT)28.30%28.75%28.63%27.43%26.21%24.31%24.89%25.38%24.27%FinancialIncomeandExpenses-12.00%-12.50%-13.00%-11.80%-10.21%-8.65%-9.20%-9.12%-8.75%EBTMargin16.30%16.25%15.63%15.62%16.01%15.66%15.70%16.26%15.51%TaxRate-17.00%-17.00%-17.50%-15.49%-17.04%-17.58%-24.24%-20.65%-28.43%ProfitAttributabletoMinorityInterests-0.40%-0.40%-0.40%-0.56%-0.67%-0.54%-0.27%-0.29%-0.28%ProfitAttributabletoDiscontinuedOps.-0.10%-0.10%-0.20%-0.22%2.92%-0.91%-4.02%0.00%0.00%GE(GeneralElectricCo.)206,550191,185169,900($Millions)210,646191,444172,936IncomeStatement-SegmentFYFYFYFYFYFYFYFYFY2009E2008E2007E200620052004200320022001NetSales210,646191,444172,936163,391147,956134,291113,421111,967126,373Infrastructure75,48166,79858,08547,42941,80337,37336,56940,11936,419CommercialFinance36,07532,50029,01823,79220,64619,52416,92715,68838,498GEMoney28,05726,22124,73721,75919,41615,73412,84510,2669,508Healthcare19,08317,91916,82516,56215,15313,45610,1988,9558,409NBCUniversal21,10118,19115,41616,18814,68912,8866,8717,1495,769Industrial26,84825,81524,58633,49432,63130,72224,98826,15426,101Corporateitemsandeliminations4,0004,0004,2694,1673,6184,5965,0233,6361,669EBT(*NoEBITinformationatSegmentlevel)34,33331,10927,02825,08022,84319,55317,88919,03518,682Infrastructure13,96412,35810,8119,0407,7696,7977,3629,1787,869CommercialFinance7,7566,9885,8825,0284,2903,5702,9072,1703,663GEMoney3,7883,4093,7023,5073,0502,5202,1611,7991,602Healthcare3,1493,0462,9783,1432,6652,2861,7011,5461,498NBCUniversal4,4314,0023,1072,9193,0922,5581,9981,6581,408Industrial1,7451,8071,9732,6942,5591,8331,3851,8372,642Corporateitemsandeliminations(500)(500)(1,425)(1,251)(582)(11)375847-%EBT(*NoEBITinformationatSegmentlevel)16.30%16.25%15.63%15.35%15.44%14.56%15.77%17.00%14.78%ChangeYoY0.05%0.62%0.28%-0.09%0.88%-1.21%-1.23%2.22%Infrastructure(%)18.50%18.50%18.61%19.06%18.58%18.19%20.13%22.88%21.61%ChangeYoY0.00%-0.11%-0.45%0.48%0.40%-1.94%-2.75%1.27%CommercialFinance(%)21.50%21.50%20.27%21.13%20.78%18.29%17.17%13.83%9.51%ChangeYoY0.00%1.23%-0.86%0.35%2.49%1.11%3.34%4.32%GEMoney(%)13.50%13.00%14.97%16.12%15.71%16.02%16.82%17.52%16.85%ChangeYoY0.50%-1.97%-1.15%0.41%-0.31%-0.81%-0.70%0.67%Healthcare(%)16.50%17.00%17.70%18.98%17.59%16.99%16.68%17.26%17.81%ChangeYoY-0.50%-0.70%-1.28%1.39%0.60%0.31%-0.58%-0.55%NBCUniversal(%)21.00%22.00%20.15%18.03%21.05%19.85%29.08%23.19%24.41%ChangeYoY-1.00%1.85%2.12%-3.02%1.20%-9.23%5.89%-1.21%Industrial(%)6.50%7.00%8.02%8.04%7.84%5.97%5.54%7.02%10.12%ChangeYoY-0.50%-1.02%-0.02%0.20%1.88%0.42%-1.48%-3.10%SalesGrowth10.03%10.70%5.84%10.43%10.18%18.40%1.30%-11.40%Infrastructure13.00%15.00%22.47%13.46%11.85%2.20%-8.85%10.16%CommercialFinance11.00%12.00%21.97%15.24%5.75%15.34%7.90%-59.25%GEMoney7.00%6.00%13.69%12.07%23.40%22.49%25.12%7.97%Healthcare6.50%6.50%1.59%9.30%12.61%31.95%13.88%6.49%NBCUniversal16.00%18.00%-4.77%10.20%13.99%87.54%-3.89%23.92%Industrial4.00%5.00%-26.60%2.64%6.21%22.95%-4.46%0.20%DCFValuation2008/1/27Ticker:
GETerminalDiscountRate=10.0%Analyst:
TerminalFCFGrowth=4.0%ForecastTerminalYear2007E2008E2009E2010E2011E2012E2013E2014E2015E2016E2017EValueRevenue172,936191,444210,646229,604250,269270,290291,913309,428327,994344,393361,613%Growthn/a.10.7%10.0%9.0%9.0%8.0%8.0%6.0%6.0%5.0%5.0%OperatingIncome(EBIT)49,51055,04059,61164,28970,07575,68181,73686,64091,83896,430101,252OperatingMargin28.6%28.7%28.3%28.0%28.0%28.0%28.0%28.0%28.0%28.0%28.0%InterestandOther-net(22,482)(23,930)(25,278)(27,552)(30,032)(32,435)(35,030)(37,131)(39,359)(41,327)(43,394)Interest%ofSales-13.0%-12.5%-12.0%-12.0%-12.0%-12.0%-12.0%-12.0%-12.0%-12.0%-12.0%Taxes3,2005,2895,8376,2456,8077,3527,9408,4168,9219,3679,836TaxRate15.5%17.5%17.0%17.0%17.0%17.0%17.0%17.0%17.0%17.0%17.0%MinorityInterest(692)(766)(843)(918)(1,001)(1,081)(1,168)(1,238)(1,312)(1,378)(1,446)DiscontinuedOps.(346)(191)(211)(211)(211)(211)(211)(211)(211)(211)(211)NetIncome22,79124,86427,44329,36232,02434,60337,38839,64442,03544,14746,365%Growthn/a.9.1%10.4%7.0%9.1%8.1%8.0%6.0%6.0%5.0%5.0%AddDepreciation/Amort10,37611,48712,63913,77615,01616,21717,51518,56619,68020,66421,697%ofSales6.0%6.0%6.0%6.0%6.0%6.0%6.0%6.0%6.0%6.0%6.0%Plus/(minus)ChangesWC199-370-384-1,148-1,251-1,351-1,460-1,547-1,640-1,722-1,808%ofSales0.12%-0.19%-0.18%-0.50%-0.50%-0.50%-0.50%-0.50%-0.50%-0.50%-0.50%SubtractCapEx17,87717,23018,95820,66422,52421,62323,35324,75426,23927,55128,929CapEx%ofsales10.3%9.0%9.0%9.0%9.0%8.0%8.0%8.0%8.0%8.0%8.0%FreeCashFlow15,48918,75020,74021,32623,26527,84530,09031,90833,83535,53737,325YoYgrowthn/a.21%11%3%9%20%8%6%6%5%5%TerminalValue646,963Terminal:
646,963NPVoffreecashflows161,99344%P/E:
14.0NPVofterminalvalue206,14256%EV/EBITDA:
8.7ProjectedEquityValue368,136FreeCashYield:
5.77%FreeCashFlowYield4.21%SharesOutstanding10,415M*SensitivityMatrixCurrentPrice$35.14r(discountrate)*Avg.Jan2008(range$33.236.8)9%10%11%Impliedequityvalue/share$35.35g(growthrate)5%$49.79$39.54$32.7541.7%12.5%-6.8%Upside/(Downside)toDCF0.6%4%$42.85$35.35$30.04ImpliedEquityValue21.9%0.6%-14.5%Upside(Downside)TotalDebt$491,623M3%$38.22$32.36$28.01TotalCash$65,057M8.8%-7.9%-20.3%Cash/share6.25


- 配套讲稿:
如PPT文件的首页显示word图标,表示该PPT已包含配套word讲稿。双击word图标可打开word文档。
- 特殊限制:
部分文档作品中含有的国旗、国徽等图片,仅作为作品整体效果示例展示,禁止商用。设计者仅对作品中独创性部分享有著作权。
- 关 键 词:
- DCF 现金流 贴现 模型 Excel 模版
 冰点文库所有资源均是用户自行上传分享,仅供网友学习交流,未经上传用户书面授权,请勿作他用。
 甲醇合成的仿真实验报告.docx
-
动态分区分配方式的模拟C语言代码和C++代码.doc
-
复合肥成品检验报告单.docx
-
优秀团员个人事迹材料.docx
-
PDCA项目-降低非计划性拔管发生率持续改进.doc
-
丙型肝炎病毒实验活动风险评估报告.docx
-
开展大兴调查研究工作方案三篇.docx
-
受限空间作业施工方案.doc
-
车辆安全管理制度..docx
-
丙型肝炎病毒实验活动风险评估报告(精品二篇).docx
-
创客中心建设方案设计.doc
-
CAN总线与RS-232转换接口电路设计.doc
 建筑LEC危险源辨识清单.xls
-
【公开课教案】《印度》第一课时教学设计.docx
-
风力发电工程质量监督检查大纲.doc
-
部编版语文四年级下册《宝葫芦的秘密》节选 公开课省级一等奖教学设计.docx
-
车辆安全管理制度.docx
-
代职总结.docx
-
小王子最经典的语录.docx
-
数据共享交换平台实施方案.docx
-
管理制度咨询公司管理制度制度(制度范本).docx
-
高层图书馆给排水毕业设计.docx
-
(完整版)常用词根词缀表(综合整理).docx
-
健康宣教|为爱急救:学会心肺复苏.docx
-
小学2022年度学校工作计划——以和美教育理念为引领 创造和美教育新生活..docx
-
Seminar教学模式研究综述-精选教育文档.docx
-
幼儿教育课题申报书:基于农村田园资源的幼儿园劳动教育的实践研究.docx
-
国家机关政府部门公文标准格式(2021最新版).docx
-
云教版五年级劳动技术教案下册(改).doc
-
学校反恐防暴自查报告 (5).docx
-
社区网格化管理精细化服务工作汇报.docx
-
公路施工现场安全标志和安全防护设施设置.doc
-
淡水生物增殖放流技术规范:䱻属赤眼鳟.docx
-
磁矩参考样品校准规范.docx
-
地方规范:辣椒病虫害综合防控技术规程(征求意见稿).docx
-
淡水池塘养殖尾水处理技术规范.docx
-
废铅蓄电池处理污染控制技术规范.docx
-
地方规范:城市道路智能交通管理设施运行维护规范(征求意见稿).docx
-
公共服务标准化试点现行标准汇编(一、幼有所育服务).docx
-
规范第三方机构参与预算绩效管理工作办法.docx
-
非洲猪瘟消毒技术规范(浙江省).docx
-
国家或地方技术规范:残疾人之家服务与管理规范.docx
-
工矿商贸企业常用环保设施安全评估导则.docx
-
国家或地方技术规范:城市绿化碳汇造林计量与监测技术规程.docx
-
光唇鱼人工繁育与养殖技术规范.docx
-
国家或地方技术规范:畜禽排泄物中喹诺酮类药物残留量的测定 液相色谱-串联质谱法.docx
-
国家或地方技术规范:餐饮计量规范.docx
-
国家或地方技术规范:稻品种试验技术规程.docx
-
国家或地方技术规范:方竹栽培技术规程.docx
-
国家或地方技术规范:城市公共客运智慧安防管理通用要求.docx
-
国家或地方技术规范:公共健身步道技术要求.docx
