 Vensim软件学习.ppt
- 文档编号:15597837
- 上传时间:2023-07-05
- 格式:PPT
- 页数:82
- 大小:1.12MB
Vensim软件学习.ppt
《Vensim软件学习.ppt》由会员分享,可在线阅读,更多相关《Vensim软件学习.ppt(82页珍藏版)》请在冰点文库上搜索。
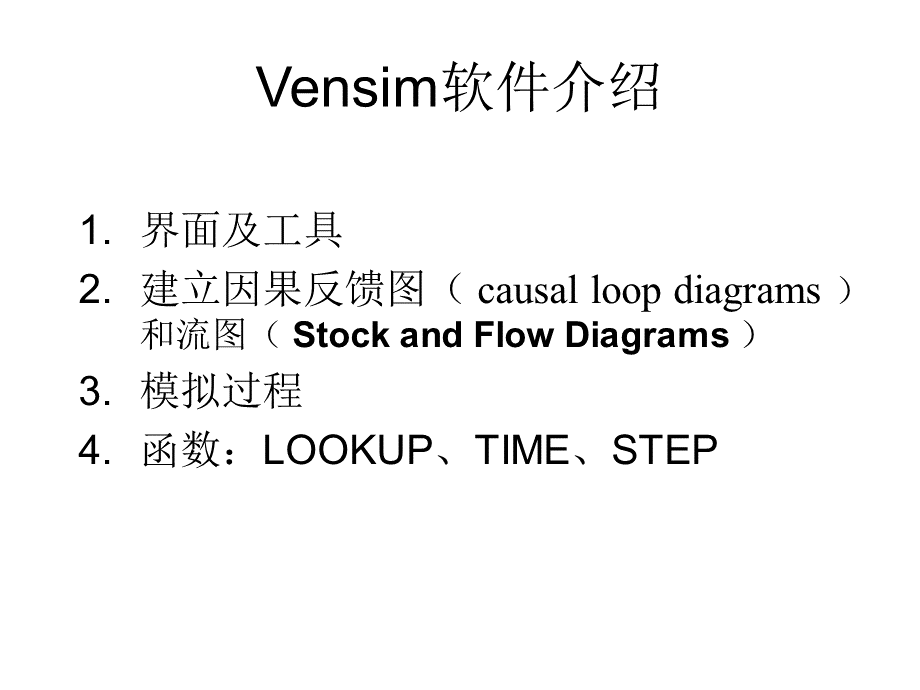
Vensim软件介绍,界面及工具建立因果反馈图(causalloopdiagrams)和流图(StockandFlowDiagrams)模拟过程函数:
LOOKUP、TIME、STEP,WhatisVensim?
Vensimisavisualmodelingtoolthatallowsyoutoconceptualize,document,simulate,analyze,andoptimizemodelsofdynamicsystems.Vensimprovidesasimpleandflexiblewayofbuildingsimulationmodelsfromcausallooporstockandflowdiagrams.Byconnectingwordswitharrows,relationshipsamongsystemvariablesareenteredandrecordedascausalconnections.ThisinformationisusedbytheEquationEditortohelpyouformacompletesimulationmodel.Youcananalyzeyourmodelthroughoutthebuildingprocess,lookingatthecausesandusesofavariable,andalsoattheloopsinvolvingthevariable.Whenyouhavebuiltamodelthatcanbesimulated,Vensimletsyouthoroughlyexplorethebehaviorofthemodel.-VensimUsersGuideVersion5,界面及工具,标题TitleBar,菜单Menu,Toolbar,绘图工具SketchTools,状态条StatusBar,StructuralAnalysisToolsCausesTreecreatesatree-typegraphicalrepresentationshowingthecausesoftheWorkbenchVariable.因果树图UsesTreecreateatree-typegraphicalrepresentationshowingtheusesoftheWorkbenchVariable.使用树图LoopsdisplaysalistofallfeedbackloopspassingthroughtheWorkbenchVariable.反馈图Documentreviewsequations,definitions,unitsofmeasure,andselectedvaluesfortheWorkbenchVariable.DatasetAnalysisToolsCausesStripGraphdisplayssimplegraphsinastrip,allowingyoutotracecausalitybyshowingthedirectcauses(asshown)oftheWorkbenchVariable.显示与所选择变量有直接关系的变量的模拟结果GraphdisplaysbehaviorinalargergraphthantheStripGraph,andcontainsdifferentoptionsforoutputthantheStripGraph.TablegeneratesatableofvaluesfortheWorkbenchVariable.RunsComparecomparesallLookupsandConstantsinthefirstloadeddatasettothoseinthesecondloadeddataset.,分析工具,AnalysisToolOutput,控制板TheControlPanelTheControlPanelallowsyoutochangeinternalsettingsthatgoverntheoperationofVensim,suchaswhichWorkbenchVariableisselectedorwhatDatasetsareloaded.,2.建立因果反馈图(Causalloopdiagram)和建立流图(Stockandflowdiagram),1)建立因果反馈图(causalloopdiagrams):
以Savings-Interest为例,演示,3种分析工具:
CauseTree;UsesTree;Loops,分析因果反馈图的逻辑结构,两个图经由变量savings的因果关系而连接,刚好分别前后对调;当反馈环向后回到该变量,则用括号括起来。
确定savings为变量后,点击Loops,列举全部有关该变量的因果反馈图,LoopNumber1oflength1savinginterestLoopNumber2oflength2savingworkeffortincome,因果反馈图只能描述反馈结构的基本方面,不能表示不同性质的变量的区别,这是其根本弱点。
如状态变量的积累概念,是系统动力学中最重要的量,然而因果反馈图全然忽视了这一点。
因此,需要建立流图。
2)建立流图(StockandFlowDiagrams)-以workforce-inventory为例,constructInventoryasaLevel,thenaddarateflowinginandarateflowingout.,Nowweneedtofigureouthowproductiongetsdetermined.addthelevelWhireratecaneitherincreaseordecreasetheworkforce.,addtheproportionalityconstantproductivity.Also,nethirerateisdependentonthevalueofWorkforce.,addinthevariablestargetworkforceandtimetoadjustworkforceandconnectthem.,Addtheconceptoftargetproduction,andconnectittotargetworkforce.Wewillsettargetproductiononthebasisofsales.,introducetargetinventory,inventorycorrectionandtwoadditionalConstants.Theideaissimple.targetinventoryistheamountofstockthatshouldbeheldbasedonexpectationsaboutsales.TheinventorycorrectionisthecorrectionforadeviationofInventoryfromitstarget.,3.模拟:
以workforce-inventory为例,ThefollowingstepsaretypicalforbuildingandusingVensimmodels.Constructamodeloropenanexistingmodel.ExaminethestructureusingthestructuralAnalysistools(TreeDiagrams.).Simulatethemodelmovingaroundmodelparameterstoseehowitresponds.ExamineinterestingbehaviorinmoredetailusingthedatasetAnalysistools(GraphsandTables).Performcontrolledsimulationexperimentsandrefinethemodel.PresentthemodelanditsbehaviortoyouraudienceusingSyntheSimresults,AnalysistooloutputcustomerGraphsandTables.,1)openanexistingmodel:
c:
ProgramFilesVensimmodelsguidechap03WFINV.MDL,2)ExaminethestructureusingthestructuralAnalysistools(TreeDiagrams.).,CausesTreeDiagram(WorkbenchVariable,Inventory,isontherightandeverythingthatcausesittochange(upto2connectionsdistant)isontheleft.),theWorkbenchVariableontheleftandwhereitisusedinthemodel(whatitcauseschange,upto2connectionsdistant)ontheright.,UsesTreeDiagram,theLoopsAnalysistool:
variablenethirerate,LoopNumber1oflength1nethirerateWorkforceLoopNumber2oflength6nethirerateWorkforceproductionInventoryinventorycorrectiontargetproductiontargetworkforce,displaysallvariablesinallfeedbackloops(two)thatpassthroughtheWorkbenchVariable(nethirerate).,3)SimulatingtheModel:
amountofInventoryovertime.,DoubleclickonthesimulationRunnameeditingboxontheToolbartohighlightthedefaultnameCurrent(orclickonceanddragoverthenameCurrent),thentypeinthenamebaserun.ClickontheSyntheSimbutton,DoubleclickonthesimulationRunnameeditingboxontheToolbaragainandreplacethenamebaserunwithexperiment.,Usingthemousedragthesliderbelowproductivitybackandforth.Asyoumovethesliderthemodelwillsimulateandtheresultswilldisplayinblue,withtheresultsfrombaserunbeingshowninred.,4)ExaminingBehavior,PositionthemouseoverWorkforceandleaveitthere.Agraphshouldpopupjustbelowworkforce.,ClickonWorkforcetoselectitintotheWorkbench.ClickontheGraphAnalysistoolTwothingsareworthnotingabouttheabovegraph.Firstbothrunsshowapatternofbehaviorknownasdampedoscillation.Second,thetworunsareidenticalexceptforscaling.,ClickonthevariableInventoryappearinginthesketchandthenclickontheGraphtool,WeseeagraphofInventorywithoscillatingbehaviorsimilartoworkforce,althoughInventorystartsoutbydecliningbeforeincreasinginvalue.Moreimportantly,thereisonlyonegraphvisible.,ClickontheTabletool,OnlyonegraphlineisvisibleforInventorybecausethevaluesareidenticalforbothruns.ChangingproductivityimpactsonlyWorkforce,targetworkforceandnethirerate.Thisisquiteclearjustbylookingatthemodeldiagramasyoudragthesliderandoccursbecauseproductivityreallyjustscalesthenumberofpeoplerequiredtoproduceoneitem.,ClickontheResetSliderbuttonorpresstheHomekeytoreturnthevalueofproductivitytoitsoriginalsetting.Repeattheaboveexperimentationprocesswitheachofthethreeremainingconstants.Dragtheslidersobservingbehaviorandthenbringupmoredetailedgraphswhenyouseesomethinginteresting.,Thethingstobelookingforwhenyouareevaluatingbehavioraretheperiodofoscillation(振动),theextentbywhichvariableschangeandthedegreeofdamping(衰减).Theperiodofoscillationisthetimefromonepeaktothenextonthetimegraphs.Dampingisthedecreaseinamplitudethatoccursfrompeaktopeak,whereamplitudeisthedistancealongtheyaxisfromtheeventualvaluethevariablesettlesto.Itshouldbeeasytoseethatproductivityandinventorycoveragedonotsignificantlychangethesewhiletimetoadjustworkforceandtimetocorrectinventorydo.,timetoadjustworkforce,5)CausalTracing,JustasyoulookedatthecausesofInventorybyusingtheCausesTreeDiagramAnalysistool,youcanalsolookatgraphsofbehaviorofthevariablesthatcauseInventorytochange.,ClickontheResetAllbuttonorusethekeycombinationCtrl+Home.ClickonInventorytoselectitintotheworkbench.ClickontheCausesStripAnalysistool,AstripgraphisgeneratedthatshowstheWorkbenchVariable(Inventory)atthetop,andallthevariablesthatdirectlycauseInventorytochangebelowit(productionandsales).wewilllookintoproductionandnotsalestounderstandthesourceofthisoscillation.,CausalTracingisaquickandpowerfultoolthathelpsusdeterminewhatportionsofamodelarecausingwhichtypesofbehavior.TheCausesandUsesTreeDiagramsandtheTabletoolcanallbeusedforCausalTracingbutthemostcommonlyusedtoolistheCausesStriptoolandwewillusethattoinvestigatethesourcesofoscillationinthismodel.,4.几个常用函数:
LOOKUP、TIME、STEP,1)LOOKUP:
说明在一个模拟模型中任意两个变量之间的函数关系;可以描述一个表格包含两个变量的一组值。
比如,改变原储蓄存款模型(Saving-Interest)。
当存款少于5000¥,利率为5;存款不少于5000¥,利率为7。
相当于原来DYNOMA中的table函数,演示,2)TIME变量一些Vensim功能明显是时间函数,为了使用这一功能,在模型中必须使用TIME当作函数。
比如,对某些产品100单位振幅与12个月季节变化需求。
时间以月为单位。
VariableDemand=100*sin(2*3.14159*Time/12),演示,注意:
Time用符号包起来,表示它是一个隐藏式变量,3)STEP函数,阶跃函数产生一个从零到给定值的一次阶跃。
比如WFINV.MDL中sales=100+STEP(50,20)TheSTEPfunctionisoneofthemostcommonlyusedinputfunctions.Thisfunctionreturns0untilTimereachesstimeandthenitreturnssheight.Inourexampleitwillreturn0tilltime20thenitwillreturn50sothatsaleswillstartat100,remainconstanttilltime20andthenjumpto150.,Vensim软件介绍,界面及工具建立因果反馈图(causalloopdiagrams)和流图(StockandFlowDiagrams)模拟过程函数:
LOOKUP、TIME、STEP,WhatisVensim?
Vensimisavisualmodelingtoolthatallowsyoutoconceptualize,document,simulate,analyze,andoptimizemodelsofdynamicsystems.Vensimprovidesasimpleandflexiblewayofbuildingsimulationmodelsfromcausallooporstockandflowdiagrams.Byconnectingwordswitharrows,relationshipsamongsystemvariablesareenteredandrecordedascausalconnections.ThisinformationisusedbytheEquationEditortohelpyouformacompletesimulationmodel.Youcananalyzeyourmodelthroughoutthebuildingprocess,lookingatthecausesandusesofavariable,andalsoattheloopsinvolvingthevariable.Whenyouhavebuiltamodelthatcanbesimulated,Vensimletsyouthoroughlyexplorethebehaviorofthemodel.-VensimUsersGuideVersion5,界面及工具,标题TitleBar,菜单Menu,Toolbar,绘图工具SketchTools,状态条StatusBar,StructuralAnalysisToolsCausesTreecreatesatree-typegraphicalrepresentationshowingthecausesoftheWorkbenchVariable.因果树图UsesTreecreateatree-typegraphicalrepresentationshow


- 配套讲稿:
如PPT文件的首页显示word图标,表示该PPT已包含配套word讲稿。双击word图标可打开word文档。
- 特殊限制:
部分文档作品中含有的国旗、国徽等图片,仅作为作品整体效果示例展示,禁止商用。设计者仅对作品中独创性部分享有著作权。
- 关 键 词:
- Vensim 软件 学习
 冰点文库所有资源均是用户自行上传分享,仅供网友学习交流,未经上传用户书面授权,请勿作他用。
 甲醇合成的仿真实验报告.docx
-
动态分区分配方式的模拟C语言代码和C++代码.doc
-
复合肥成品检验报告单.docx
-
优秀团员个人事迹材料.docx
-
PDCA项目-降低非计划性拔管发生率持续改进.doc
-
丙型肝炎病毒实验活动风险评估报告.docx
-
开展大兴调查研究工作方案三篇.docx
-
受限空间作业施工方案.doc
-
车辆安全管理制度..docx
-
丙型肝炎病毒实验活动风险评估报告(精品二篇).docx
-
创客中心建设方案设计.doc
-
CAN总线与RS-232转换接口电路设计.doc
 建筑LEC危险源辨识清单.xls
-
【公开课教案】《印度》第一课时教学设计.docx
-
风力发电工程质量监督检查大纲.doc
-
部编版语文四年级下册《宝葫芦的秘密》节选 公开课省级一等奖教学设计.docx
-
车辆安全管理制度.docx
-
代职总结.docx
-
小王子最经典的语录.docx
-
数据共享交换平台实施方案.docx
-
管理制度咨询公司管理制度制度(制度范本).docx
-
高层图书馆给排水毕业设计.docx
-
(完整版)常用词根词缀表(综合整理).docx
-
健康宣教|为爱急救:学会心肺复苏.docx
-
小学2022年度学校工作计划——以和美教育理念为引领 创造和美教育新生活..docx
-
Seminar教学模式研究综述-精选教育文档.docx
-
幼儿教育课题申报书:基于农村田园资源的幼儿园劳动教育的实践研究.docx
-
国家机关政府部门公文标准格式(2021最新版).docx
-
云教版五年级劳动技术教案下册(改).doc
-
学校反恐防暴自查报告 (5).docx
-
社区网格化管理精细化服务工作汇报.docx
-
公路施工现场安全标志和安全防护设施设置.doc
-
必备员工爱岗敬业演讲稿4篇.docx
-
八年级英语教师工作计划.docx
-
初中语文教师学年度教育教学总结.docx
-
考研英语口语复试模板经典完整版已经整理好可直接打印.docx
-
必备主任竞聘演讲稿集锦7篇.docx
-
班级女生节活动总结班级活动总结.docx
-
创建无烟校园工作总结3篇.docx
-
毕业典礼成长门主持词串词范文.docx
-
保险销售培训员工个人心得体会.docx
-
打火匣读后感.docx
-
毕业留言语录集锦100条.docx
-
大班教育笔记随笔心得体会范文大全.docx
-
本科生大三自我鉴定.docx
-
毕业生警察实习报告5篇.docx
-
大二学生寒假社会实践报告总结.docx
-
工地实习报告心得范文精选.docx
-
毕业生自我总结集合5篇.docx
-
大四生产实习报告.docx
-
工匠强国梦心得体会.docx
