 雅思A类Task 图表作文实例下Word文件下载.docx
- 文档编号:8443622
- 上传时间:2023-05-11
- 格式:DOCX
- 页数:9
- 大小:88.92KB
雅思A类Task 图表作文实例下Word文件下载.docx
《雅思A类Task 图表作文实例下Word文件下载.docx》由会员分享,可在线阅读,更多相关《雅思A类Task 图表作文实例下Word文件下载.docx(9页珍藏版)》请在冰点文库上搜索。
Tues.
Wed.
Thurs.
Fri.
Sat.
Sun.
Lunch
$2,400
$2,450
$2,595
$2,375
$2,500
$1,950
$1,550
Dinner
$3,623
$3,850
$3,445
$3,800
$4,350
$2,900
modelanswer:
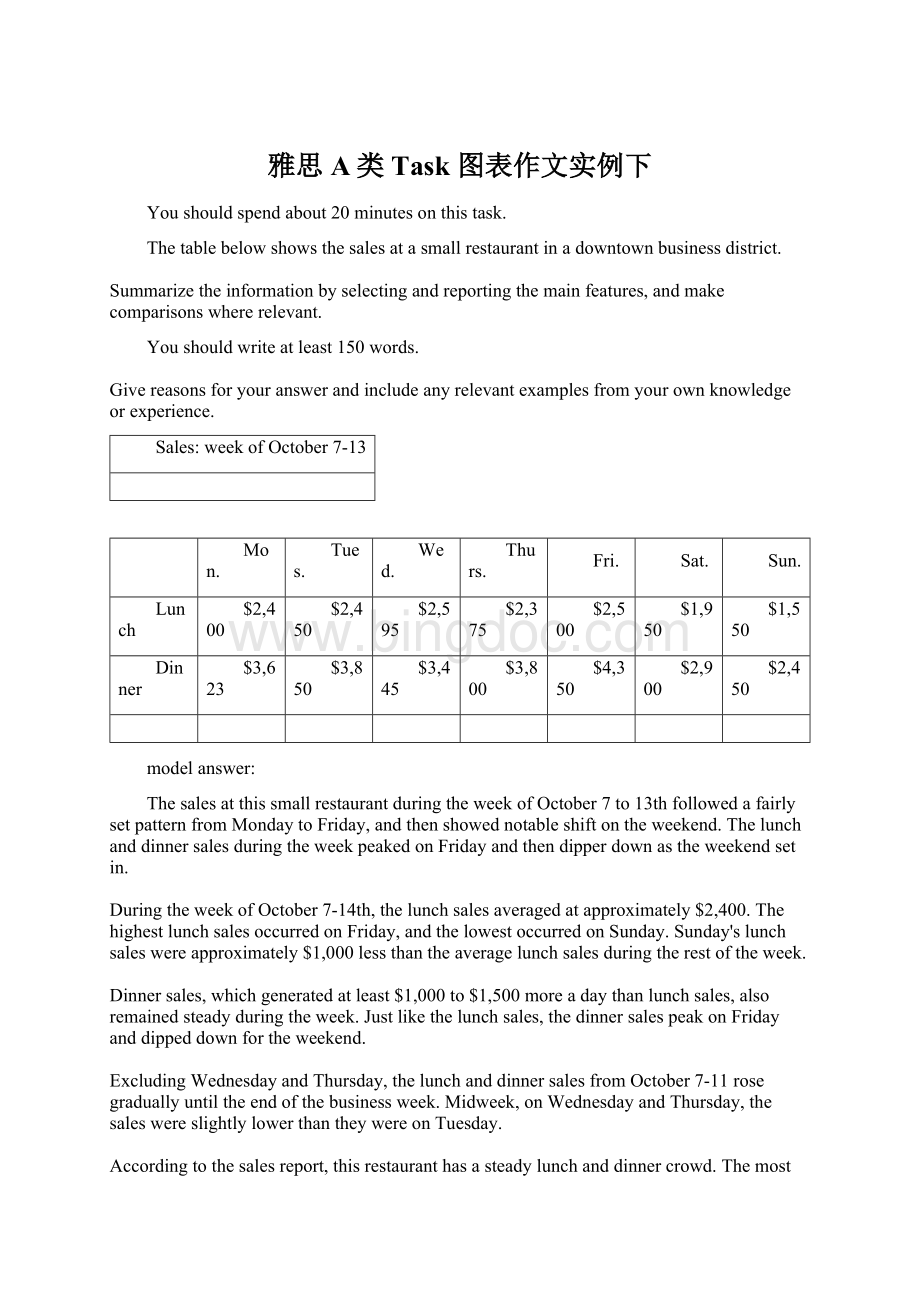
ThesalesatthissmallrestaurantduringtheweekofOctober7to13thfollowedafairlysetpatternfromMondaytoFriday,andthenshowednotableshiftontheweekend.ThelunchanddinnersalesduringtheweekpeakedonFridayandthendipperdownastheweekendsetin.
DuringtheweekofOctober7-14th,thelunchsalesaveragedatapproximately$2,400.ThehighestlunchsalesoccurredonFriday,andthelowestoccurredonSunday.Sunday'
slunchsaleswereapproximately$1,000lessthantheaveragelunchsalesduringtherestoftheweek.
Dinnersales,whichgeneratedatleast$1,000to$1,500moreadaythanlunchsales,alsoremainedsteadyduringtheweek.Justlikethelunchsales,thedinnersalespeakonFridayanddippeddownfortheweekend.
ExcludingWednesdayandThursday,thelunchanddinnersalesfromOctober7-11rosegraduallyuntiltheendofthebusinessweek.Midweek,onWednesdayandThursday,thesaleswereslightlylowerthantheywereonTuesday.
Accordingtothesalesreport,thisrestauranthasasteadylunchanddinnercrowd.ThemostprofitabledayduringthesecondweekofOctoberwasFriday.Sunday,wastheleastprof¬
itableday,withthefullday'
ssalestotaling/totallinglessthantheFridaydinnersales.Thesenumbersarereflectiveofarestaurantthatislocatedinabusiness/financialdistrictwherebusinesshoursareMondaythroughFriday.
(234words)
InJune1996,anexperimentalfluvaccinewastrialledinalargecountrytownonfemalesonly.
Summarisetheinformationbyselectingandreportingthemainfeatures,andmakecomparisonswhererelevant.
Thediagramsshowdataforafluepidemicwhichhitalargecountrytownin1996.Figure1givesthenumberofpersonswhodied;
Figure2showsthepercentagebreakdownoffemaleswhoreceivedanewfluvaccine;
andFigure3givesthenumberofcasesofflubeforeandduringtheepidemic.
InFigure1itcanbeseenthatthefluwasresponsibleforthedeathsof2femalesbutnomalesintheperiodfromMarchtoMay.However,fromJunetoAugust,therewere4femaledeathsand1maledeath.
AccordingtothepiechartinFigure2,onlythosefemalesmostatriskweregiventhenewfluvaccine;
28%didnottakepartinthetrial.Ofthosefemaleswhotookpart,35%wereaged(over65yearsold);
24%werebabiesorchildren;
and13%wereeitherhospitalisedorreceivingothermedicalattention.
FromFigure3itisclearthatthenewvaccinehadapositiveeffectonthenumberofnewcasesofflureportedinfemales.Therewerejustover1000casesreportedinMarch,climbingrapidlytoapeakof3500inJune.Thereafter,thenumberofcasesdroppedslowlytoabout2800inAugust,beforelevellingoffat2500fortherestoftheyear.Formales,thefigureswerelowerbutshowedasimilartrendthroughouttheepidemic.
(232words)
Thechartbelowshowsestimatedworldliteracyratesbyregionandbygenderfortheyear2000.
Writeareportforauniversitylecturerdescribingtheinformationbelow.
InthisreportIwilldescribeabarchartthatshowstheestimatedworldilliteracyratesbygenderandregionfortheyear2000.
FirstIwilllookatmaleilliteracyforthe6areasshown.ThelowestrateswereinDevelopedCountries,LatinAmerica/CaribbeanandEastAsia/Oceaniawithratesof1%(approximately),10%and8%(approximately)respectively.Theratesforthenextthreeareasweremuchhigherandquitesimilartoeachother.Sub-SaharanAfrica,theArabStatesandSouthAsiahadratesofapproximately31%,29%and34%.
FemaleilliteracywasmuchhigherrelativelyineachareaexceptLatinAmerica/Caribbeanwhereitwasonlyslightlyhigher.ThelowestratesforfemaleilliteracywereagainDevelopedCountries,LatinAmerica/CaribbeanandEastAsia/Oceaniawithratesofapproximately2%,12%and20%.Againtheratesforthenextthreeareasweremuchhigherandquitesimilartoeachother.Sub-SaharanAfrica,theArabStatesandSouthAsiahadratesofapproximately48%,52%and56%.
Thisendsmyreport.
(168words)
Thechartshowsthenumberofmobilephonesandlandlinesper100peopleinselectedcountries.
Writeareportforauniversitylecturerdescribingtheinformationgiven.
Thegraphshowsthenumberofmobilephonesandlandlinesper100users,forselectedcountries.Overall,mostofthecountriesincludedinthegraphhavemoremobilephonessubscribersthanlandlines.
MostEuropeancountrieshavehighmobilephoneuse.ThebiggestusersofmobilephonesaretheItalians,with88cellphonesper100people.Forexample,Italyhastwiceasmanymobilephonesaslandlines,with88mobilesperhundredpeoplecomparedto45forlandlines.MobilephoneuseislowinCanada,withfewerthan40phonesper100people.Denmarkisalsounusualbecauseithasslightlymorelandlinesthanmobilephones.
However,insomecountries,thenumberoflandlinesishigherthanthenumberofmobilephones.OneexampleistheUSA,wherethenumberofmobiles,at50per100people,ismuchlowerthanthenumberoflandlines,atalmost70perhundred.AsimilarpatterncanbeseeninCanada.ThehighestnumberoflandlinesinthegraphisinDenmark,withabout90per100people.Incontrast,thelowestfiguresforfixedlinesareinItalyandtheUK.
Inconclusion,itseemsthatmobilephoneuseishigherinEuropethaninNorthAm
ThegraphsshowenrolmentindifferentcollegesintheHigherCollegesofTechnologyin1999.
Writeatotalof150-200wordsabouttheinformationinthethreegraphs.
ThechartsshowsstudentenrolmentbygenderandlevelindifferentcollegesoftheHigherCollegesofTechnologycollegesintheUAE.
Therearecleardifferencesinmaleandfemaleenrolment.Femalesoutnumbermeninallthecolleges,withalmost25%morestudentsinDubaiWomen'
scollegethaninDubaiMen'
s.RasAl-KhaimahWomen'
sCollegehasalmost180students,comparedtoonly100intheMen'
scollege.
Femalesalsooutnumbermalesbylevel,withalmostdoublethenumberofmenatHigherDiplomalevel(330comparedto181).OnlyatDiplomaleveldoesthenumberofmenslightlyexceedthatofwomen.
OverhalfthestudentsareinCertificatelevel,withlessthanaquarteratHigherDiplomaorBachelorlevel.
Inconclusion,moststudentsintheHigherCollegesareenrolledatDiplomalevelorbelow,andthemajorityofstudentsarewomen.
(143words)
ThelinegraphbelowshowsthenumberofannualvisitstoAustraliabyoverseasresidents.Thetablebelowgivesinformationonthecountryoforiginwherethevisitorscamefrom.Writeareportforauniversitylecturerdescribingtheinformationgiven.
NUMBEROFVISITORS(million)
1975
2005
SOUTHKOREA
JAPAN
CHINA
USA
BRITAIN
EUROPE
2.9
3.2
0.3
0.4
0.9
1.1
9.1
12.0
0.8
1.1
4.5
Total
8.8
30.4
ThegivenlinegraphillustratesinformationonthenumberofoverseasvisitorstravelingtoAustraliainmillionsofpeople.Overall,onenotabletrendseemstobethatAustraliahassteadilybecomemorepopularasadestinationspot.Forexample,therewere20millionmorevisitorstoAustraliain2005thanin1975.That'
sajumpfrom10millionto30millionin20years.
ThesecondtablegivesstatisticsshowingthecountrieswhoseresidentswenttoAustraliabetween1975and2005.Inbothyears,thelargestnumberofvisitorscamefromJapan,followedbySouthKoreaandEurope.Britain,theUnitedStatesandChinaalsohadmanypeopletravelingtoAustraliaintheseyears.Infact,thenumberofpeoplevisitingAustraliagrewineveryoneofthesecountries.Forexample,in2005,12millionpeoplewenttherefromJapancomparedwithonly3.2millionin1975.
(147words)


- 配套讲稿:
如PPT文件的首页显示word图标,表示该PPT已包含配套word讲稿。双击word图标可打开word文档。
- 特殊限制:
部分文档作品中含有的国旗、国徽等图片,仅作为作品整体效果示例展示,禁止商用。设计者仅对作品中独创性部分享有著作权。
- 关 键 词:
- 雅思A类Task 图表作文实例下 雅思 Task 图表 作文 实例
 冰点文库所有资源均是用户自行上传分享,仅供网友学习交流,未经上传用户书面授权,请勿作他用。
 《财经法规》新大纲试题doc.docx
-
《古代汉语专题》练习题库参考答案.docx
-
《好玩的球》大班教案.docx
-
《道德宣传标语》.docx
-
《多媒体技术与应用》教学大纲完整版.docx
-
《红楼梦》名著导读.docx
-
《家政服务母婴生活护理服务质量规范》中华人民共和国国家标准之欧阳总创编.docx
-
《跨越百年的美丽》初中生读后感10篇.docx
-
《旅游学》课后习题答案.docx
-
《商务谈判第二版》章后习题答案.docx
-
《公共基础知识》考点巩固经济考点最新版46.docx
-
《好的故事》原文和教学设计.docx
-
《dsp原理及应用修订版》邹彦主编课后答案个人终极修订版.docx
-
《计算机图形学》答案第四章.docx
-
《《药品经营许可证》零售核准程序》.docx
-
#基于WEB的停车场管理系统设计和实现.docx
-
《包身工》知识讲解.docx
-
《匆匆》读书笔记15篇.docx
-
《歌剧魅影》的观后感范文600字.docx
-
《树》美术教案.docx
-
《微报告》.docx
-
《财经法规与会计职业道德》测试题及答案.docx
-
《古诗两首》教学设计之三《池上》《小儿垂钓》.docx
-
《快乐数学》大班教案.docx
-
《青蓝工程工作总结》.docx
-
《为了和平》第二集《殊死较量》观后感作文最新5篇.docx
-
《信息的传递》单元测试题一.docx
-
《用比例解决问题》教学设计.docx
-
《中国石拱桥》教学设计15篇.docx
-
4可行性分析与需求分析.docx
-
7系统集成技术要求.docx
-
12星座运势.docx
-
小学综合实践活动课教学设计鲁香丽.docx
-
校企合作实施方案.docx
-
协议离婚协议书完整版五篇.docx
-
英语时文泛读 第三册 Unit 3 中美在非洲援助.docx
-
英语英语英语书面表达汇编练习题含答案.docx
-
新版二级建造师《建设工程法规及相关知识》模拟考试C卷附解析.docx
-
应用型高校机械创新实验室建设的探索与实践.docx
-
优化设计心得体会范文精选范文.docx
-
新冠疫情防控工作方案.docx
-
会计师事务所基本情况表.docx
-
婚庆管理与服务专业实习周记范本优质版.docx
-
混凝土结构事故分析与处理正式版.docx
-
最新文档加强基层医疗实施方案起草说明word范文模板 10页.docx
-
最新沿途的风景高中作文八篇范文word版 10页.docx
-
江西省新余市第七中学学年度高二年级下学期期中英语试题.docx
-
浆砌石护坡及素混凝土喷护施工方案.docx
-
机械加工厂绩效考核管理制度.docx
-
机械式变速器.docx
-
教科版小学品德与社会六年级上册全册教案.docx
