 雅思小作文考官范文表格类.docx
- 文档编号:12278594
- 上传时间:2023-06-05
- 格式:DOCX
- 页数:7
- 大小:167.04KB
雅思小作文考官范文表格类.docx
《雅思小作文考官范文表格类.docx》由会员分享,可在线阅读,更多相关《雅思小作文考官范文表格类.docx(7页珍藏版)》请在冰点文库上搜索。
雅思小作文考官范文表格类
2020年雅思小作文考官范文——表格类
主题:
地下铁
题型:
表格
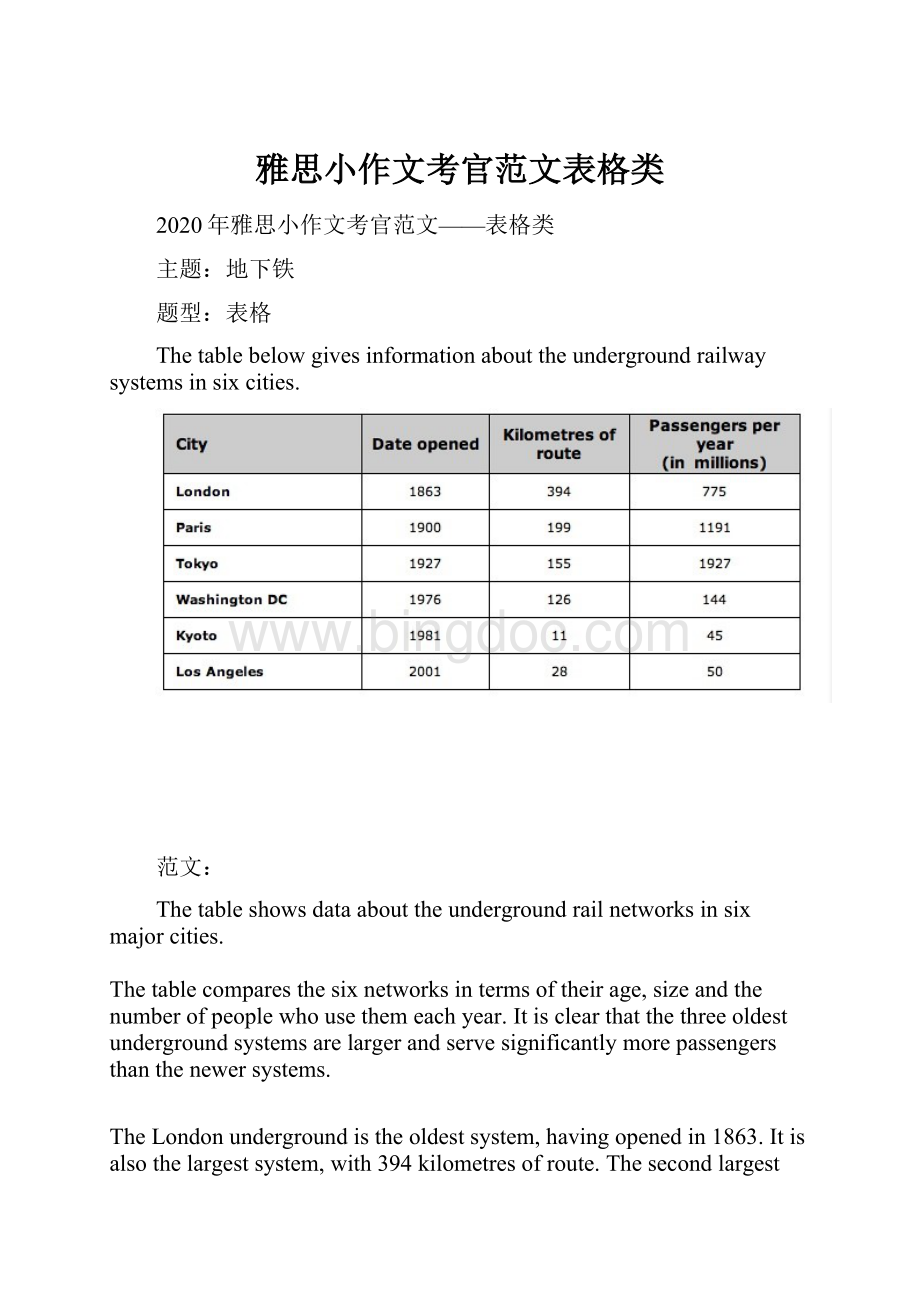
Thetablebelowgivesinformationabouttheundergroundrailwaysystemsinsixcities.
范文:
Thetableshowsdataabouttheundergroundrailnetworksinsixmajorcities.
Thetablecomparesthesixnetworksintermsoftheirage,sizeandthenumberofpeoplewhousethemeachyear.Itisclearthatthethreeoldestundergroundsystemsarelargerandservesignificantlymorepassengersthanthenewersystems.
TheLondonundergroundistheoldestsystem,havingopenedin1863.Itisalsothelargestsystem,with394kilometresofroute.Thesecondlargestsystem,inParis,isonlyabouthalfthesizeoftheLondonunderground,with199kilometresofroute.However,itservesmorepeopleperyear.Whileonlythirdintermsofsize,theTokyosystemiseasilythemostused,with1927millionpassengersperyear.
Ofthethreenewernetworks,theWashingtonDCundergroundisthemostextensive,with126kilometresofroute,comparedtoonly11kilometresand28kilometresfortheKyotoandLosAngelessystems.TheLosAngelesnetworkisthenewest,havingopenedin2001,whiletheKyotonetworkisthesmallestandservesonly45millionpassengersperyear.
主题:
贫困家庭
题型:
表格
ThetablebelowshowstheproportionofdifferentcategoriesoffamilieslivinginpovertyinAustraliain1999.
满分范文:
ThetablegivesinformationaboutpovertyratesamongsixtypesofhouseholdinAustraliaintheyear1999.
Itisnoticeablethatlevelsofpovertywerehigherforsinglepeoplethanforcouples,andpeoplewithchildrenweremorelikelytobepoorthanthosewithout.Povertyrateswereconsiderablyloweramongelderlypeople.
Justoveronefifthofsingleparentswerelivinginpoverty,whereasonly12%ofparentslivingwithapartnerwereclassedaspoor.Thesamepatterncanbeseenforpeoplewithnochildren:
while19%ofsinglepeopleinthisgroupwerelivingbelowthepovertyline,thefigureforcoupleswasmuchlower,atonly7%.
Overall,11%ofAustralians,or1,837,000people,werelivinginpovertyin1999.Agedpeopleweretheleastlikelytobepoor,withpovertylevelsof6%and4%forsingleagedpeopleandagedcouplesrespectively.
主题:
垃圾制造
题型:
表格
Thetablebelowshowstheamountofwasteproduction(inmillionsoftonnes)insixdifferentcountriesoveratwenty-yearperiod.
满分范文:
Thechartcomparestheamountsofwastethatwereproducedinsixcountriesintheyears1980,1990and2000.
Ineachoftheseyears,theUSproducedmorewastethanIreland,Japan,Korea,PolandandPortugalcombined.ItisalsonoticeablethatKoreawastheonlycountrythatmanagedtoreduceitswasteoutputbytheyear2000.
Between1980and2000,wasteproductionintheUSrosefrom131to192milliontonnes,andrisingtrendswerealsoseeninJapan,PolandandPortugal.Japan’swasteoutputincreasedfrom28to53milliontonnes,whilePolandandPortugalsawwastetotalsincreasefrom4to6.6andfrom2to5milliontonnesrespectively.
ThetrendsforIrelandandKoreawerenoticeablydifferentfromthosedescribedabove.InIreland,wasteproductionincreasedmorethaneightfold,fromonly0.6milliontonnesin1980to5milliontonnesin2000.Korea,bycontrast,cutitswasteoutputby12milliontonnesbetween1990and2000.
主题:
手机用途
题型:
表格
Thetableshowsthepercentagesofmobilephoneownersusingvariousmobilephonefeatures.
满分范文:
Thetablecomparesthepercentagesofpeopleusingdifferentfunctionsoftheirmobilephonesbetween2006and2010.
Throughouttheperiodshown,themainreasonwhypeopleusedtheirmobilephoneswastomakecalls.However,therewasamarkedincreaseinthepopularityofothermobilephonefeatures,particularlytheInternetsearchfeature.
In2006,100%ofmobilephoneownersusedtheirphonestomakecalls,whilethenextmostpopularfunctionsweretextmessaging(73%)andtakingphotos(66%).Bycontrast,lessthan20%ofownersplayedgamesormusicontheirphones,andtherewerenofiguresforusersdoingInternetsearchesorrecordingvideo.
Overthefollowing4years,therewasrelativelylittlechangeinthefiguresforthetopthreemobilephonefeatures.However,thepercentageofpeopleusingtheirphonestoaccesstheInternetjumpedto41%in2008andthento73%in2010.Therewasalsoasignificantriseintheuseofmobilestoplaygamesandtorecordvideo,withfiguresreaching41%and35%respectivelyin2010.
主题:
骑车上班
题型:
表格
ThetablebelowshowschangesinthenumbersofresidentscyclingtoworkindifferentareasoftheUKbetween2001and2011.
满分范文:
ThetablecomparesthenumbersofpeoplewhocycledtoworkintwelveareasoftheUKintheyears2001and2011.
In2001,wellover43thousandresidentsofinnerLondoncommutedbybicycle,andthisfigurerosetomorethan106thousandin2011,anincreaseof144%.Bycontrast,althoughouterLondonhadthesecondhighestnumberofcyclingcommutersineachyear,thepercentagechange,atonly45%,wasthelowestofthetwelveareasshowninthetable.
BrightonandHovesawthesecondbiggestincrease(109%)inthenumberofresidentscyclingtowork,butBristolwastheUK’ssecondcityintermsoftotalnumbersofcyclingcommuters,with8,108in2001and15,768in2011.Figuresfortheothereightareaswerebelowthe10thousandmarkinboth
Overall,thenumberofUKcommuterswhotravelledtoworkbybicycleroseconsiderablyoverthe10-yearperiod.InnerLondonhadbyfarthehighestnumberofcyclingcommutersinbothyears.
主题:
消费开支
题型:
表格
Thetablebelowgivesinformationonconsumerspendingondifferentitemsinfivedifferentcountriesin2002.Percentageofnationalconsumerexpenditurebycategory-2002。
满分范文:
Thetableshowspercentagesofconsumerexpenditureforthreecategoriesofproductsandservicesinfivecountriesin2002.
Itisclearthatthelargestproportionofconsumerspendingineachcountrywentonfood,drinksandtobacco.Ontheotherhand,theleisure/educationcategoryhasthelowestpercentagesinthetable.
Outofthefivecountries,consumerspendingonfood,drinksandtobaccowasnoticeablyhigherinTurkey,at32.14%,andIreland,atnearly29%.TheproportionofspendingonleisureandeducationwasalsohighestinTurkey,at4.35%,whileexpenditureonclothingandfootwearwassignificantlyhigherinItaly,at9%,thaninanyoftheothercountries.
ItcanbeseenthatSwedenhadthelowestpercentagesofnationalconsumerexpenditureforfood/drinks/tobaccoandforclothing/footwear,atnearly16%andjustover5%respectively.Spainhadslightlyhigherfiguresforthesecategories,butthelowestfigureforleisure/education,atonly1.98%.


- 配套讲稿:
如PPT文件的首页显示word图标,表示该PPT已包含配套word讲稿。双击word图标可打开word文档。
- 特殊限制:
部分文档作品中含有的国旗、国徽等图片,仅作为作品整体效果示例展示,禁止商用。设计者仅对作品中独创性部分享有著作权。
- 关 键 词:
- 雅思 作文 考官 范文 表格
 冰点文库所有资源均是用户自行上传分享,仅供网友学习交流,未经上传用户书面授权,请勿作他用。
 #电控发动机的故障诊断与排除.docx
-
《财务管理学》人大版第五章习题答案.docx
-
《公路养护工程量清单及计量规范》编制.docx
-
《反抗之真心英雄》读后感.docx
-
《C语言程序设计》阅读程序写结果试题汇总.docx
-
《汉书艺文志》小说家与子部小说著录.docx
-
《江苏省建设工程施工项目经理部和项目监理机构主要管理人员配备办法》.docx
-
《C语言程序设计》课程形成性考核作业.docx
-
《诚实与信任》教学设计.docx
-
《变化社会中的政治秩序》读后感.docx
-
《44光的折射》教案.docx
-
《归去来兮辞》优化教案及课文解析.docx
-
《大数据导论》19秋期末考核0001.docx
-
《大型养路机械使用管理规则》.docx
-
《混凝土结构工程施工质量验收规范》GB 条文说明.docx
-
《会计基础》练习答案解析.docx
-
《民法典》试题第三编合同二试题及答案.docx
-
《建设工程消防监督管理规定》公安部119号令1101.docx
-
《赢》杰克韦尔奇读书笔记.docx
-
《活出全新的自己》读后感精选9篇.docx
-
《拿破仑传》读后感范文5篇.docx
-
《去年的树》课堂实录及点评doc.docx
-
《人体解剖生理学》练习题库.docx
-
00以内整数加减.docx
-
《手工制作中培养幼儿创意能力的实践研究》完整.docx
-
《校园防汛工作计划》.docx
-
06年批发零售业研究报告.docx
-
《小王子》金句赏析英语作文.docx
-
《中华人民共和国职业病防治法》条文释义下.docx
-
007电子请柬.docx
-
1物业事业部运营管理方案.docx
-
《新闻写作教程》中篇整理资料.docx
-
祖国在我心中演讲稿200字精选多篇.docx
-
35策略1121.docx
-
最详细景观设计合同.docx
-
中短期天气预报质量检验办法精品管理资料.docx
-
福建省莆田市七年级历史下学期期中试题.docx
-
120车载视频监控指挥系统方案知识讲解.docx
-
父母作文之父母的爱作文评语.docx
-
最新XX系统性能测试报告.docx
-
学年班级鉴定评语最新.docx
-
感恩节大会主持词及流程.docx
-
钢筋结构施工组织方案通用.docx
-
学年度高中历史 第2单元第3讲 第二次世界大战的全面爆发学案 新人教版选修3.docx
-
最新初一入学考试英语试题含答案.docx
-
高二化学选修5第一章检测题二.docx
-
高级工试题一小车可编程序控制器.docx
-
高考地理一轮复习学案学案14 大规模的海水运动剖析.docx
-
高考模拟届苏锡常镇四市高三教学情况调研二模生物.docx
-
高考文言阅读高频词归类.docx
-
高考语法填空专题汇编 打印版.docx
