 jfreechart线图柱图饼图散点图Word文档格式.docx
- 文档编号:7278382
- 上传时间:2023-05-08
- 格式:DOCX
- 页数:42
- 大小:22.72KB
jfreechart线图柱图饼图散点图Word文档格式.docx
《jfreechart线图柱图饼图散点图Word文档格式.docx》由会员分享,可在线阅读,更多相关《jfreechart线图柱图饼图散点图Word文档格式.docx(42页珍藏版)》请在冰点文库上搜索。
*/
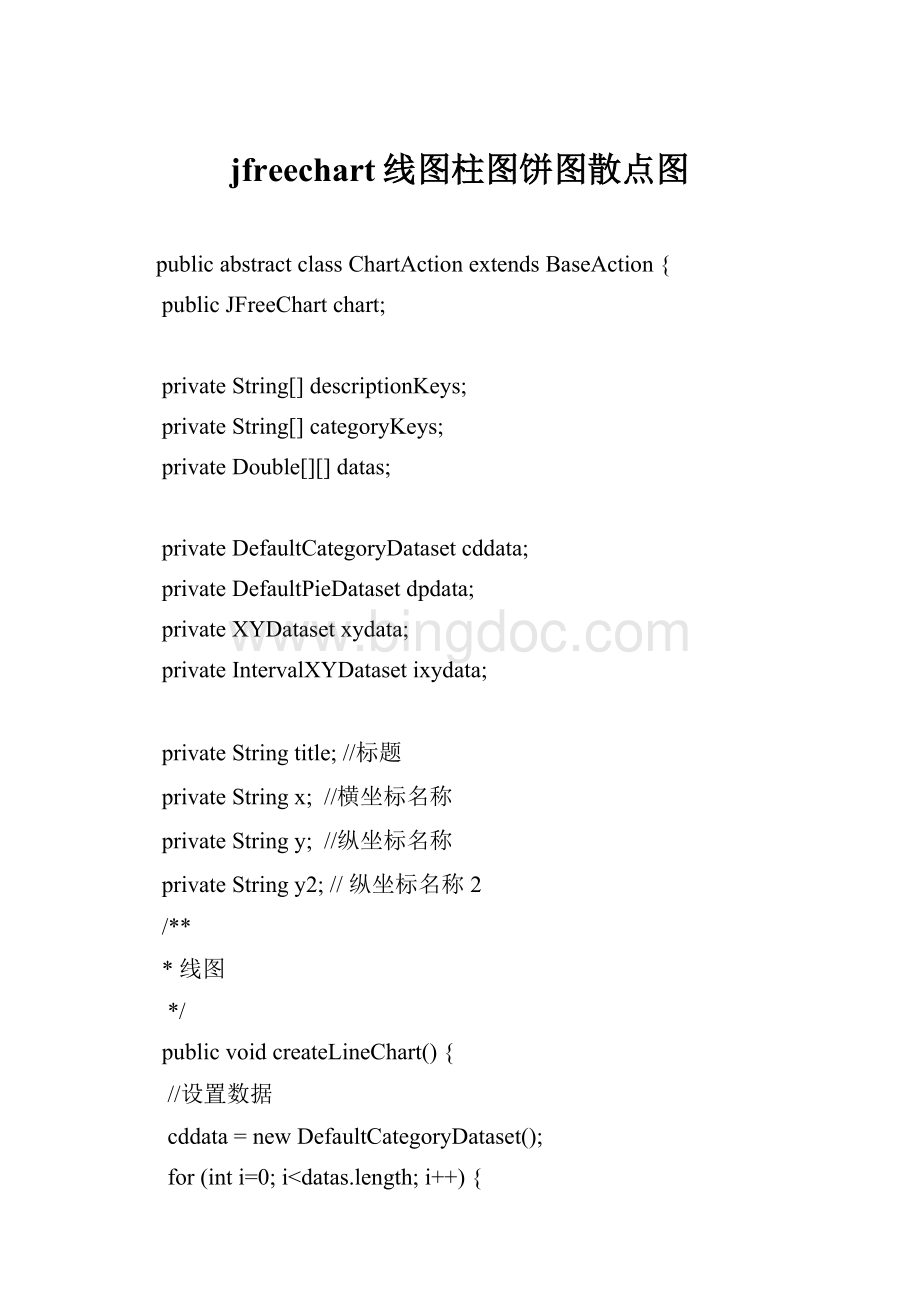
publicvoidcreateLineChart(){
//设置数据
cddata=newDefaultCategoryDataset();
for(inti=0;
i<
datas.length;
i++){
if(datas[i].length==0){
cddata.setValue(null,"
"
categoryKeys[i]);
}else{
for(intj=0;
j<
datas[i].length;
j++){
cddata.setValue(datas[i][j],descriptionKeys[j],categoryKeys[i]);
}
}
}
/**数据
System.out.println("
**************************datasbegin:
**************************"
);
for(intj=0;
System.out.println(categoryKeys[i]+"
:
"
+descriptionKeys[j]+"
|"
+datas[i][j]);
}
**************************datasend:
****************************"
chart=ChartFactory.createLineChart(title,//图表标题
x,//目录轴的显示标签
y,//数值轴的显示标签
cddata,//数据集
PlotOrientation.VERTICAL,//图表方向:
水平、垂直
true,//是否显示图例(对于简单的柱状图必须是false)
true,//是否生成工具
false);
//是否生成URL
CategoryPlotplot=chart.getCategoryPlot();
plot.setBackgroundPaint(newColor(238,244,255));
//设置图表的颜色
plot.setDomainGridlinePaint(Color.lightGray);
//设置垂直网格线的颜色
plot.setRangeGridlinePaint(Color.lightGray);
//设置水平网格线的颜色
plot.setDomainGridlinesVisible(true);
//设置垂直网格线是否显示
plot.setRangeGridlinesVisible(true);
//设置水平网格线是否显示
LineAndShapeRendererlineandshaperenderer=(LineAndShapeRenderer)plot.getRenderer();
lineandshaperenderer.setBaseShapesVisible(true);
lineandshaperenderer.setBaseShapesFilled(true);
chart.setBackgroundPaint(Color.white);
setChartFont("
}
*饼图
publicvoidcreatePieChart(){
dpdata=newDefaultPieDataset();
//生成JFreeChart对象
Doubled=0.0;
descriptionKeys.length;
d=d+(datas[j][i]==null?
0:
datas[j][i]);
dpdata.setValue(descriptionKeys[i],d.doubleValue());
chart=ChartFactory.createPieChart(title,dpdata,true,true,true);
PiePlotplot=(PiePlot)chart.getPlot();
//设置图表的颜色
plot.setNoDataMessage("
没有数据!
plot.setLabelGenerator(newStandardPieSectionLabelGenerator(
("
{0}:
({2})"
),
NumberFormat.getNumberInstance(),
newDecimalFormat("
0.00%"
)));
PieChart"
publicvoidcreatePieChartValue(Double[]value){
dpdata.setValue(descriptionKeys[i],value[i]);
plot.setLabelGenerator(null);
plot.setToolTipGenerator(newStandardPieToolTipGenerator(("
{0}"
LegendTitlelegend=chart.getLegend();
legend.setBackgroundPaint(newColor(238,244,255));
//图例背景
legend.setItemFont(newFont("
宋体"
Font.ITALIC,12));
//图例的字体
legend.setPosition(RectangleEdge.RIGHT);
//图例位置
legend.setHeight(1000.00);
*柱图
publicvoidcreateBarChart(){
chart=ChartFactory.createBarChart(title,//图表标题
cddata,//数据集
水平、垂直
true,//是否显示图例(对于简单的柱状图必须是false)
true,//是否生成工具
false//是否生成URL
);
//设置图表的颜色
publicvoidcreateBarChart3D(Object[]data){
data.length;
cddata.setValue((Number)data[i],categoryKeys[i],categoryKeys[i]);
chart=ChartFactory.createBarChart3D(title,//图表标题
*对比柱状图
publicvoidcreateBarChart(CategoryDatasetdataset){
dataset,//数据集
*面积图
publicvoidcreateAreaChart(){
chart=ChartFactory.createAreaChart(title,//图表标题
*X,Y线图chart
*paramchartMap
*/
publicvoidcreateXYLineChart(Map<
String,Map<
Double,Double>
>
chartMap){
//创建XYDataset对象(准备数据)
xydata=createXYDataset(chartMap);
//创建JFreeChart对象:
ChartFactory.createXYLineChart
chart=ChartFactory.createXYLineChart(title,//标题
x,//categoryAxisLabel(category轴,横轴,X轴标签)
y,//valueAxisLabel(value轴,纵轴,Y轴的标签)
xydata,//dataset
PlotOrientation.VERTICAL,
true,//legend
true,//tooltips
true);
//URLs
//使用CategoryPlot设置各种参数。
以下设置可以省略。
XYPlotplot=(XYPlot)chart.getPlot();
//x轴整数显示
NumberAxisna=(NumberAxis)plot.getDomainAxis();
na.setStandardTickUnits(NumberAxis.createIntegerTickUnits());
XYLineAndShapeRendererrenderer=(XYLineAndShapeRenderer)plot.getRenderer();
renderer.setBaseItemLabelsVisible(true);
renderer.setBaseShapesVisible(true);
renderer.setBaseShapesFilled(true);
plot.setRenderer(0,renderer);
XYChart"
*双y轴曲线图,没有折线点
*paramcddata
publicvoidcreateXYsLineChart(DefaultCategoryDatasetcddataLeft,DefaultCategoryDatasetcddataRight){
//设置字体样式
Fontfs=newFont("
微软雅黑"
Font.BOLD,12);
Fontf=newFont("
Font.PLAIN,12);
chart=ChartFactory.createLineChart(title,//标题
cddataLeft,//dataset
CategoryPlotplot=(CategoryPlot)chart.getPlot();
//设置X坐标的显示方式(默认水平)
CategoryAxiscategoryaxis=plot.getDomainAxis();
categoryaxis.setCategoryLabelPositions(CategoryLabelPositions.UP_90);
categoryaxis.setCategoryMargin(9);
//分类轴边距
//左边y轴显示方式
//NumberAxisnumberaxis=(NumberAxis)plotxy.getRangeAxis();
//y轴整数显示
NumberAxisnumberaxis=newNumberAxis(this.y);
numberaxis.setLabelFont(fs);
numberaxis.setTickLabelFont(f);
plot.setRangeAxis(0,numberaxis);
//右边y轴显示方式
NumberAxisnumberaxis2=newNumberAxis(this.y2);
numberaxis2.setLabelFont(fs);
numberaxis2.setTickLabelFont(f);
plot.setRangeAxis(1,numberaxis2);
plot.setDataset(1,cddataRight);
plot.mapDatasetToRangeAxis(1,1);
//y轴(左边)
LineAndShapeRendererrenderer=(LineAndShapeRenderer)plot.getRenderer();
renderer.setSeriesStroke(0,newBasicStroke(1.6F));
//y轴(右边),绘制单元对象LineAndShapeRenderer
LineAnd


- 配套讲稿:
如PPT文件的首页显示word图标,表示该PPT已包含配套word讲稿。双击word图标可打开word文档。
- 特殊限制:
部分文档作品中含有的国旗、国徽等图片,仅作为作品整体效果示例展示,禁止商用。设计者仅对作品中独创性部分享有著作权。
- 关 键 词:
- jfreechart 线图 柱图饼图散点图
 冰点文库所有资源均是用户自行上传分享,仅供网友学习交流,未经上传用户书面授权,请勿作他用。
 《安全在我心中生命在我手中》主题班会教案.docx
-
《传热学》第五版名词解释总结沈阳建筑大学09级考试重点.docx
-
《3S技术基础》复习题综合.docx
-
《财务管理》各章复习思考题和有有关计算题.docx
-
《地下防水工程质量验收规范》GB.docx
-
《企业文化》考试.docx
-
《通风与空调工程施工质量验收规范》GB50243.docx
-
《短文两篇》备课笔记.docx
-
《管理会计》模拟考试题电子教案.docx
-
《花鼓》教学设计.docx
-
《旅游政策与法规》复习思考题.docx
-
《诺曼底号遇难记》第二课时教学设计教案教学设计.docx
-
《管理学基础》配伍题库.docx
-
《泡沫经济对金融危机的影响》.docx
-
《套圈游戏》教学反思.docx
-
《我们的祖国》教案.docx
-
《学习雷锋精神》演讲稿7篇.docx
-
《艺术设计概论》复习题.docx
-
2施工管理重点和难点分析.docx
-
9板框压滤机技术协议书.docx
-
18小稻秧脱险记教学设计381.docx
-
82液压2基础题.docx
-
400接线员岗位职责.docx
-
《病历书写基本规范》考试题及答案A卷.docx
-
《发展心理学》测验试题.docx
-
《测量管理体系认证技术标准》.docx
-
《健康教育宣传方案优秀范文5篇》.docx
-
《8纠正措施》.docx
-
《从罗丹得到的启示》的教案设计修改版.docx
-
《老王》优质课教学设计部编人教版七年级下册.docx
-
《概率论与数理统计》课后习题解答.docx
-
《财务管理学》第三版复习提纲内容教材.docx
-
放风筝三年级作文10篇.docx
-
哲学教案意识的作用.docx
-
各种管线事故应急预案.docx
-
MATLAB常用函数.docx
-
非可视对讲系统施工方案.docx
-
浙江省印刷行业挥发性有机物VOCs排放量计算暂行方法.docx
-
法学实习报告模板汇编6篇.docx
-
MF案例财务报表分析案例分析3.docx
-
分省命题汇编.docx
-
整理贵州省公路条例.docx
-
工厂员工合同协议书.docx
-
CA锁办理流程.docx
-
第34届全国中学生物理竞赛决赛真题几答案.docx
-
证券从业资格考试证券投资基金模拟题三.docx
-
方钢尺寸规格表.docx
-
CNG加气站建设工程施工组织设计完整版doc 76页.docx
-
全国农村环境污染防治规划纲要Word格式文档下载.doc
-
知识管理系统需求分析新.docx
-
第二章语言层面的感受与品味.docx
