 雅思小作文折线图.docx
- 文档编号:7028608
- 上传时间:2023-05-11
- 格式:DOCX
- 页数:8
- 大小:47.84KB
雅思小作文折线图.docx
《雅思小作文折线图.docx》由会员分享,可在线阅读,更多相关《雅思小作文折线图.docx(8页珍藏版)》请在冰点文库上搜索。
雅思小作文折线图
Writingtaskone:
singlelinegraph
Youwillbegivenagraphwithasingleline.Yourtaskistowritea150wordreporttodescribetheinformationgiveninthegraph.Youarenotaskedtogiveyouropinion.Youshouldspendaroundtwentyminutesonthetask.Taskoneisnotworthasmanymarksastasktwoandsoyoushouldmakesurethatyoukeepwithintherecommendedtwentyminutetimeframe.
Whatisbeingtestedisyourabilityto:
∙objectivelydescribetheinformationgiventoyou
∙reportonatopicwithouttheuseofopinion
∙usesuitablelanguagetodescribethegraph
Sampletask
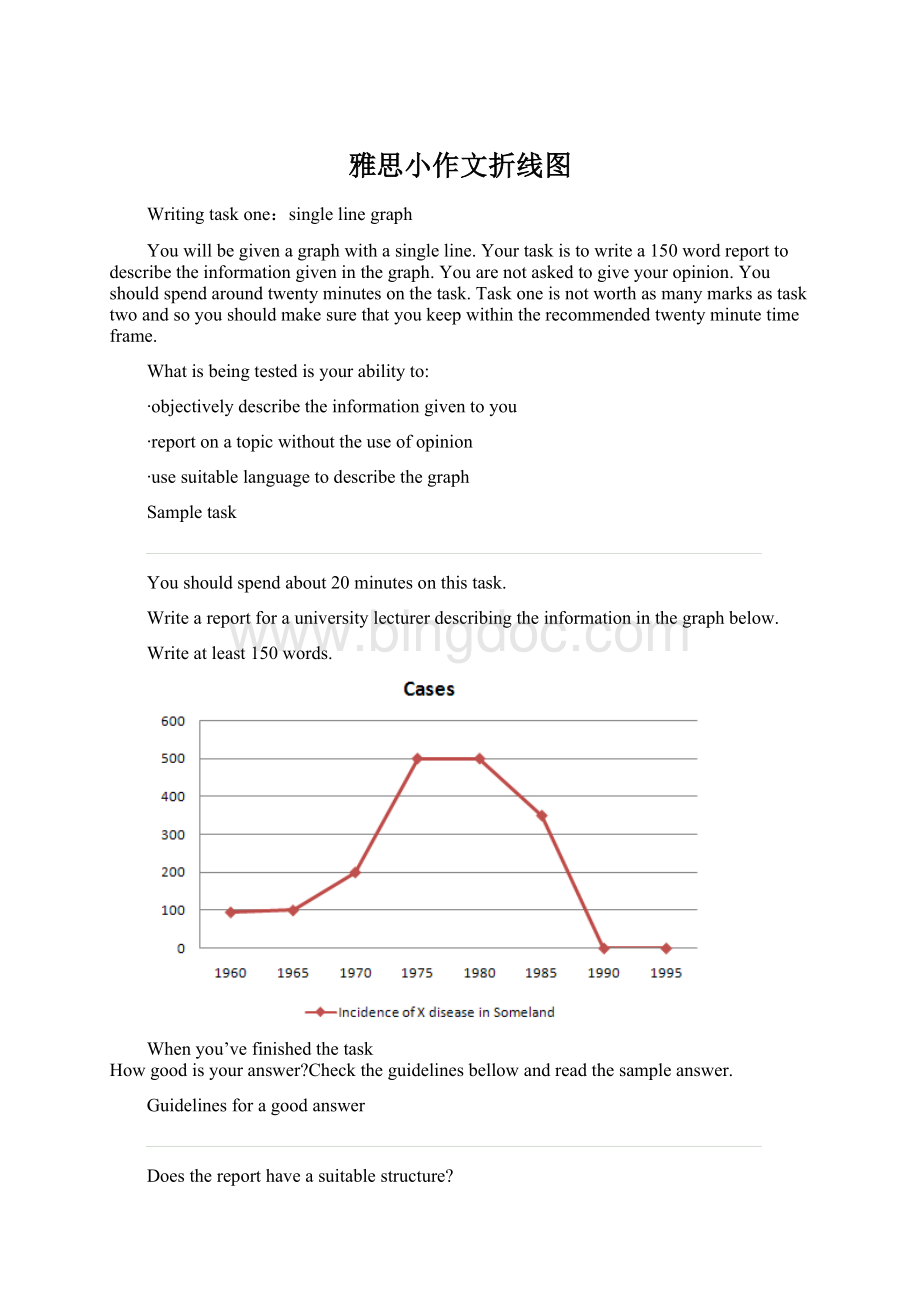
Youshouldspendabout20minutesonthistask.
Writeareportforauniversitylecturerdescribingtheinformationinthegraphbelow.
Writeatleast150words.
Whenyou’vefinishedthetask
Howgoodisyouranswer?
Checktheguidelinesbellowandreadthesampleanswer.
Guidelinesforagoodanswer
Doesthereporthaveasuitablestructure?
∙Doesithaveanintroduction,bodyandconclusion?
∙Doesitincludeconnectivewordstomakethewritingcohesivewithinsentencesandparagraphs?
Doesthereportusesuitablegrammarandvocabulary?
∙Doesitincludeavarietyofsentencestructures?
∙Doesitincludearangeofappropriatevocabulary?
Doesthereportmeettherequirementsofthetask?
∙Doesitmeetthewordlimitrequirements?
∙Doesitdescribethewholegraphadequately?
∙Doesitfocusontheimportanttrendspresentedinthegraphicinformation?
Sampleanswer
ThegraphshowsthenumberofcasesofXdiseaseinSomelandbetweentheyears1960and1995.Asanoveralltrend,itisclearthatthenumberofcasesofthediseaseincreasedfairlyrapidlyuntilthemidseventies,remainedconstantforaroundadecadeat500casesbeforedroppingtozerointhelate80s.
In1960,thenumberofcasesstoodatapproximately100.Thatnumberrosesteadilyto200by1969andthenmoresharplyto500in1977.Atthispointthenumberofcasesremainedstableuntil1984beforeplummetingtozeroby1988.From1988to1995Somelandwasfreeofthedisease.
Inconclusion,thegraphshowsthatthediseasewasincreasinglyprevalentuntilthe1980swhenitwaseradicatedfromSomeland.
Whatdoyouthink?
Whatisyouropinionofthissampleanswer?
Howwelldoesitmeettherequirementsoftheguidelines?
Readtheteacher'scommentsonthisanswer.
Teacher'scommentsonthesampleanswer
“Thereportstructureiseasytofollowandlogicalwithaclearintroduction,bodyandconclusion.Thecandidateusescohesivewordstoconnectpiecesofinformationandmakethewritingflowsuchas‘until’and‘before’inthesecondsentence.Thecandidateusesavarietyofgrammaticalstructuresandvocabularysothatthewritingisnotrepetitive.
Intermsoftaskrequirementsthereportisalittleshortbutthisisbecausethesimplegraphusedasanexampledoesnothavesufficientinformationforthecandidatetodescribe.IntherealIELTStestthegraphwillhavemoreinformationandsotheneedtolookfortrendswillbeevengreaterthaninthisexample.”
StrategiesforimprovingyourIELTSscore
Selectinginformation
Itisimportantthatyoudescribethewholegraphfully.However,thisdoesnotmeanthatyoushouldnoteeverydetail.Inmostcasestherewillbetoomuchinformationforyoutomentioneachfigure.Youwillthereforeneedtosummarisethegraphbydividingitintoitsmainparts.Thisiswhatwemeanbydescribingthetrends.
Forexample,inachronologicallinegraphitmightseemsensibletodescribetheinformationyearbyyearorperiodbyperiod.Thegraphabovegivestheinformationinfiveyearsectionssowecouldwriteourreportlikethis:
ThenumberofcasesofXdiseasestartedat50in1965andthenwentupgraduallyto100in1965andcontinuedupto200in1970andthenwentupmoresharplyto380in1975.
Whilethiswayofdescribingtheinformationmaybeaccurate,itdoesnotmeaningfullysumuptheinformationinthegraph.Infact,theinformationinthegraphwouldmostmeaningfullybedescribedinfourchronologicalsectionsfollowingtheshapeofthegraph.
IntheSampleTask,thegraphshowsfourmaintrends:
∙first,agradualincreasefrom1960to1968
∙second,asteeperincreasefrom1968to1977
∙third,aplateaufrom1977to1983
∙fourth,adropfrom1983to1988
Thestructureofthereportmustshowthesefourmaintrendsclearly.
Reportstructure
Yourreportshouldbestructuredsimplywithanintroduction,bodyandconclusion.Tensesshouldbeusedappropriately.
Introduction
Usetwostandardopeningsentencestointroduceyourreport.Theseopeningsentencesshouldmakeupthefirstparagraph.Sentenceoneshoulddefinewhatthegraphisabout;thatis,thedate,location,whatisbeingdescribedinthegraphetc.Forexample:
ThegraphshowsthenumberofcasesofXdiseaseinSomelandbetweentheyears1960and1995…
Noticethetenseused.Eventhoughitdescribesinformationfromthepast,thegraphshowstheinformationinthepresenttime.
Noticethatthesampleopeningsentencedoesnotsimplycopythewordsusedonthegraphicmaterial.Copiedsentenceswillnotbeassessedbytheexaminerandsoyouwasteyourtimeincludingthem.
Describingtheoveralltrend
Sentencetwo(andpossiblythree)mightsumuptheoveralltrend.Forexample:
ItcanbeclearlyseenthatXdiseaseincreasedrapidlyto500casesaroundthe1980sandthendroppedtozerobefore1999,whileYdiseasefellconsistentlyfromahighpointofnearly600casesin1960tolessthan100casesin1995.
Noticethetenseused.Herewearetalkingabouttheoccurrenceofthediseaseinthepast.
Describingthegraphindetail
Thebodyofthereportwilldescribethegraphorgraphsindetail.Youwillneedtodecideonthemostclearandlogicalordertopresentthematerial.
Linegraphsgenerallypresentinformationinchronologicalorderandsothemostlogicalorderforyoutowriteuptheinformationwould,mostprobablybefromearliesttolatest.Bargraphs,piechartsareorganisedindifferentwaysandsoyouneedtodecideontheorganisationofeachone.
Concludingsentences
Yourreportmayendwithoneortwosentenceswhichsummariseyourreporttodrawarelevantconclusion.
Grammarandvocabulary
Avoidingrepetition
Youwillreceiveahighermarkifyourwritingusesarangeofstructuresandvocabularycorrectlyratherthanalimitednumber.Forexample,thecandidatewhowrites:
ThenumberofcasesofXdiseasestartedat50in1965andthenwentupto200in1970andthenwentupto500in1980andthenwentdowntozeroin1990.
willlosemarksforbeingrepetitive.Youshouldthereforepractisewritingreportsusingawidevarietyoftermstodescribethedifferentmovementsinthegraphsanddifferentstructurestovaryyourwriting.
Describingtrends
Trendsarechangesormovements.Thesechangesarenormallyexpressedinnumericitems,forexample,population,productionvolumesorunemployment.Therearethreebasictrends:
Expressingmovement:
nounsandverbs
Foreachtrendthereareanumberofverbsandnounstoexpressthemovement.Wecanuseaverbofchange,forexample:
Unemploymentlevelsfell
Orwecanusearelatednoun,forexample:
Therewasafallinunemploymentlevels
Direction
Verbs
Nouns
Rose(to)
Increased(to)
Wentup(to)
Climbed(to)
Boomed
Arise
Anincrease
Growth
Anupwardtrend
Aboom(adramaticrise)
Fell(to)
Declined(to)
Decreased(to)
Dipped(to)
Dropped(to)
Wentdown(to)
Slumped(to)
Reduced(to)
Adecrease
Adecline
Afall
Adrop
Aslump(adramaticfall)
Areduction
Levelledout(at)
Didnotchange
Remainedstable(at)
Remainedsteady(at)
Stayedconstant(at)
Maintainedthesamelevel
Alevellingout
Nochange
Fluctuated(around)
Peaked(at)
Plateaued(at)
Stoodat(weusethisphrasetofocusonaparticularpoint,beforewementionthemovement,forexample:
Inthefirstyear,unemploymentstoodat…)
Afluctuation
Reachedapeak(of)
Reachedatplateau(at)
Describingthemovement:
adjectivesandadverbs
Sometimesweneedtogivemoreinformationaboutatrendasfollows:
Therehasbeenaslightincreaseinthevalueofthedollar(degreeofchange)
Unemploymentfellrapidlylastyear(thespeedofchange)
Rememberthatwemodifyanounwithanadjective(aslightincrease)andaverbwithanadverb(toincreaseslightly).
Describingthedegreeofchange
Adjectives
Adverbs
dramatic
dramatically
sharp
sharply
huge
enormous
enormously
steep
steeply
substantial
substantially
considerable
considerably
significant
significantly
marked
markedly
moderate
moderately
slight
slightly
small
minimal
minimally
Describingthespeedofchange
Adjectives
Adverbs
rapid
rapidly
quick
quickly
swift
swiftly
sudden
suddenly
steady
steadily
gradual
gradually
slow
slowly
Exercise1
Usethefollowingtermsandanyothersnecessarytodescribethegraphbelow.
initially,stoodat,dip/dipped,peak/peaked,level/levelledout
Wecandescribeatrendbylookingat:
∙thedifferencebetweentwolevels
∙theendpointofthetrend
Describingthedifferencebetweentwolevels
Thisyearunemploymenthasincreased by 20,000cases(thedifferencebetweenthisyearandlastyearis20,000cases).
Thisyeartherehasbeenanincreaseinunemployment of 5%.
Noticetheprepositions.Weusetoincrease by (withtheverb)andanincrease of (withthenoun).
Describingtheendpoint
Thisyearunemploymenthasrisento10%(theendresultisthatunemploymentisupto10%).
Thisyeartherehasbeenariseinunemploymentto10%.
Noticetheprepositions.Weusetorise to (withtheverb)andarise to (withthenoun).
Exercise2
Write3sentencesdescribingthegraphbelowusing by, of


- 配套讲稿:
如PPT文件的首页显示word图标,表示该PPT已包含配套word讲稿。双击word图标可打开word文档。
- 特殊限制:
部分文档作品中含有的国旗、国徽等图片,仅作为作品整体效果示例展示,禁止商用。设计者仅对作品中独创性部分享有著作权。
- 关 键 词:
- 雅思 作文 折线
 冰点文库所有资源均是用户自行上传分享,仅供网友学习交流,未经上传用户书面授权,请勿作他用。
 《安全在我心中生命在我手中》主题班会教案.docx
-
《传热学》第五版名词解释总结沈阳建筑大学09级考试重点.docx
-
《3S技术基础》复习题综合.docx
-
《财务管理》各章复习思考题和有有关计算题.docx
-
《地下防水工程质量验收规范》GB.docx
-
《企业文化》考试.docx
-
《通风与空调工程施工质量验收规范》GB50243.docx
-
《短文两篇》备课笔记.docx
-
《管理会计》模拟考试题电子教案.docx
-
《花鼓》教学设计.docx
-
《旅游政策与法规》复习思考题.docx
-
《诺曼底号遇难记》第二课时教学设计教案教学设计.docx
-
《管理学基础》配伍题库.docx
-
《泡沫经济对金融危机的影响》.docx
-
《套圈游戏》教学反思.docx
-
《我们的祖国》教案.docx
-
《学习雷锋精神》演讲稿7篇.docx
-
《艺术设计概论》复习题.docx
-
2施工管理重点和难点分析.docx
-
9板框压滤机技术协议书.docx
-
18小稻秧脱险记教学设计381.docx
-
82液压2基础题.docx
-
400接线员岗位职责.docx
-
《病历书写基本规范》考试题及答案A卷.docx
-
《发展心理学》测验试题.docx
-
《测量管理体系认证技术标准》.docx
-
《健康教育宣传方案优秀范文5篇》.docx
-
《8纠正措施》.docx
-
《从罗丹得到的启示》的教案设计修改版.docx
-
《老王》优质课教学设计部编人教版七年级下册.docx
-
《概率论与数理统计》课后习题解答.docx
-
《财务管理学》第三版复习提纲内容教材.docx
-
公会主播合作协议标准版docx.docx
-
关于制度的社会学研究综述.docx
-
海上钢琴师影评精选15篇.docx
-
公务员法选择题及答案.docx
-
管理系统中计算机应用复习提纲.docx
-
行业内计算公式大全.docx
-
股权众筹模式案例分析图文版资料.docx
-
管理者情商学习心得说课材料.docx
-
关于《钢铁是怎样炼成的》读书心得800字6篇.docx
-
好的作文开头.docx
-
光伏并网发电项目并网逆变器技术协议.docx
-
关于检验科工作总结范文合集8篇.docx
-
合水县畜牧兽医站动物检疫站聘用干部考试试题汇编.docx
-
广东省届九年级物理下学期模拟试题3.docx
-
关于描写背影的句子.docx
-
广西壮族自治区装配式建筑试点示范管理办法doc.docx
-
和美少年个人事迹集锦700字精选.docx
-
关于世界校园读书日活动策划方案精选三篇.docx
-
锅炉煮炉工艺规程.docx
