 R语言代码试题答案步骤.docx
- 文档编号:2160225
- 上传时间:2023-05-02
- 格式:DOCX
- 页数:21
- 大小:332.55KB
R语言代码试题答案步骤.docx
《R语言代码试题答案步骤.docx》由会员分享,可在线阅读,更多相关《R语言代码试题答案步骤.docx(21页珍藏版)》请在冰点文库上搜索。
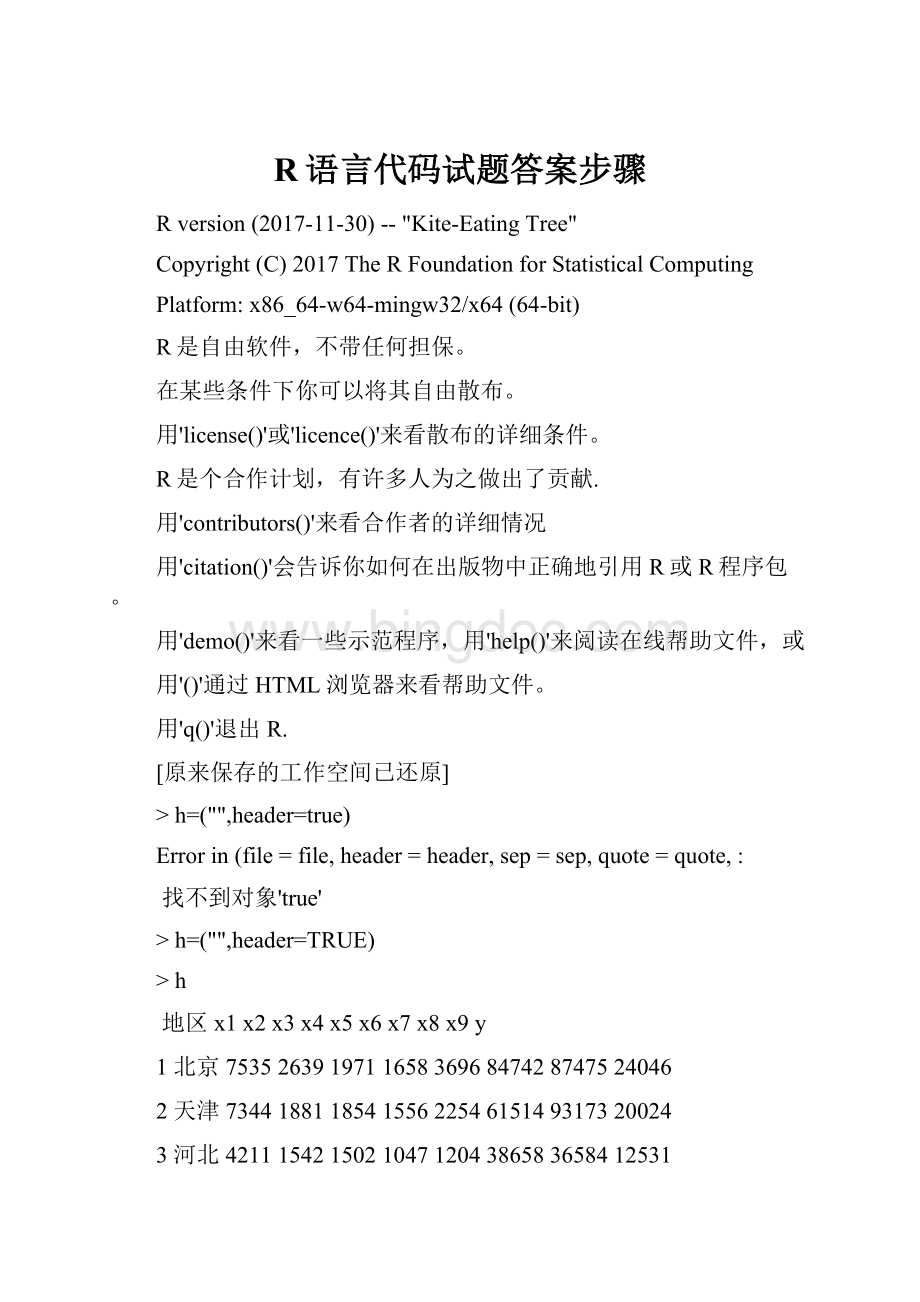
R语言代码试题答案步骤
Rversion(2017-11-30)--"Kite-EatingTree"
Copyright(C)2017TheRFoundationforStatisticalComputing
Platform:
x86_64-w64-mingw32/x64(64-bit)
R是自由软件,不带任何担保。
在某些条件下你可以将其自由散布。
用'license()'或'licence()'来看散布的详细条件。
R是个合作计划,有许多人为之做出了贡献.
用'contributors()'来看合作者的详细情况
用'citation()'会告诉你如何在出版物中正确地引用R或R程序包。
用'demo()'来看一些示范程序,用'help()'来阅读在线帮助文件,或
用'()'通过HTML浏览器来看帮助文件。
用'q()'退出R.
[原来保存的工作空间已还原]
>h=("",header=true)
Errorin(file=file,header=header,sep=sep,quote=quote,:
找不到对象'true'
>h=("",header=TRUE)
>h
地区x1x2x3x4x5x6x7x8x9y
1北京75352639197116583696847428747524046
2天津73441881185415562254615149317320024
3河北42111542150210471204386583658412531
4山西3856152914399061506442363362812212
5内蒙古54632730158413541972465576388617717
6辽宁58092042143313101844418585664916594
7吉林46352045159414481643384074341514614
8黑龙江46871807133711811217364063571112984
9上海96562111179010173724786738537326253
10江苏66581916143710583078506396834718825
11浙江75522110155212282997501976337421545
12安徽58151541139711431933446012879215012
13福建7317163417547732105445255276318593
14江西5072147711746711487385122880012776
15山东52012197157210051656419045176815778
16河南46071886119110851525373383149913733
17湖北58381783137110301652398463857214496
18湖南5442162513029181738389713348014609
19广东82581521210010482954502785409522396
20广西5553114613778841626363862795214244
21海南655686515219931320394853237714457
22重庆68702229117711021471444983891416573
23四川6074165112847731587423392960815050
24贵州4993139910146551396411561971012586
25云南546817609749391434376292219513884
26西藏55181362845467550517052293611184
27陕西55511789132212122079430733856415333
28甘肃46021631128810501388376792197812847
29青海4667151212329061097464833318112346
30宁夏47691876119310631516474363639414067
31新疆52392031116710281281445763379613892
>lm=lm(y~x1+x2+x3+x4+x5+x6+x7+x8+x9,data=h)
>lm
Call:
lm(formula=y~x1+x2+x3+x4+x5+x6+x7+x8+x9,
data=h)
Coefficients:
(Intercept)x1x2x3x4x5x6x7x8x9
>summary(lm)
Call:
lm(formula=y~x1+x2+x3+x4+x5+x6+x7+x8+x9,
data=h)
Residuals:
Min1QMedian3QMax
Coefficients:
EstimateStd.ErrortvaluePr(>|t|)
(Intercept)+02+03
x1+00***
x2+00***
x3+00***
x4
x5+00***
x6
x7
x8+01+01
x9+01+02
---
Signif.codes:
0‘***’‘**’‘*’‘.’‘’1
Residualstandarderror:
on21degreesoffreedom
MultipleR-squared:
AdjustedR-squared:
F-statistic:
on9and21DF,p-value:
<
>pre=(lm)
>res=residuals(lm)
>sd(res)
[1]
>res=residuals(lm)
>dy=step(lm)
Start:
AIC=
y~x1+x2+x3+x4+x5+x6+x7+x8+x9
DfSumofSqRSSAIC
-x41213184326
-x91171493201454
-x71177003202005
-x81542953238599
-x61895863273891
-x3126625935846898
-x2145610567745361
-x519377500
-x11
Step:
AIC=
y~x1+x2+x3+x5+x6+x7+x8+x9
DfSumofSqRSSAIC
-x91174283201754
-x71185633202889
-x81544373238763
-x61918133276139
-x3129361306120456
-x2154679418652267
-x519393345
-x11
Step:
AIC=
y~x1+x2+x3+x5+x6+x7+x8
DfSumofSqRSSAIC
-x71346343236387
-x61748003276554
-x81821503283904
-x3130553536257107
-x2157258368927590
-x519382624
-x11
Step:
AIC=
y~x1+x2+x3+x5+x6+x8
DfSumofSqRSSAIC
-x81708133307201
-x611527773389165
-x3155012848737672
-x218895049
-x519458098
-x11
Step:
AIC=
y~x1+x2+x3+x5+x6
DfSumofSqRSSAIC
-x611375403444741
-x3157710639078264
-x218871193
-x519473521
-x11
Step:
AIC=
y~x1+x2+x3+x5
DfSumofSqRSSAIC
-x3157178839162624
-x21
-x51
-x11
>summary(dy)
Call:
lm(formula=y~x1+x2+x3+x5,data=h)
Residuals:
Min1QMedian3QMax
Coefficients:
EstimateStd.ErrortvaluePr(>|t|)
(Intercept)**
x1***
x2***
x3***
x5***
---
Signif.codes:
0‘***’‘**’‘*’‘.’‘’1
Residualstandarderror:
364on26degreesoffreedom
MultipleR-squared:
AdjustedR-squared:
F-statistic:
on4and26DF,p-value:
<
>newdata=(x1=5200,x2=2000,x3=1100,x4=1000,x5=1300,x6=45000,x7=34000,x8=,x9=
>predict(dy,newdata,interval="confidence")
fitlwrupr
1
>
>h=ts("",header=TRUE))
>h
TimeSeries:
Start=1
End=56
Frequency=1
X78
[1,]-58
[2,]53
[3,]-63
[4,]13
[5,]-6
[6,]-16
[7,]-14
[8,]3
[9,]-74
[10,]89
[11,]-48
[12,]-14
[13,]32
[14,]56
[15,]-86
[16,]-66
[17,]50
[18,]26
[19,]59
[20,]-47
[21,]-83
[22,]2
[23,]-1
[24,]124
[25,]-106
[26,]113
[27,]-76
[28,]-47
[29,]-32
[30,]39
[31,]-30
[32,]6
[33,]-73
[34,]18
[35,]2
[36,]-24
[37,]23
[38,]-38
[39,]91
[40,]-56
[41,]-58
[42,]1
[43,]14
[44,]-4
[45,]77
[46,]-127
[47,]97
[48,]10
[49,]-28
[50,]-17
[51,]23
[52,]-2
[53,]48
[54,]-131
[55,]65
[56,]-17
>plot(h,type="o")
>local({pkg<-(sort(.packages=TRUE)),graphics=TRUE)
+if(nchar(pkg))library(pkg,=TRUE)})
Warningmessage:
程辑包‘urca’是用R版本来建造的
>adf=(h),type=c("drift"),selectlags=c("AIC"))
>summary(adf)
###############################################
#AugmentedDickey-FullerTestUnitRootTest#
###############################################
Testregressiondrift
Call:
lm(formula=~+1+Min1QMedian3QMax
Coefficients:
EstimateStd.ErrortvaluePr(>|t|)
(Intercept)
***
---
Signif.codes:
0‘***’‘**’‘*’‘.’‘’1
Residualstandarderror:
on51degreesoffreedom
MultipleR-squared:
AdjustedR-squared:
F-statistic:
on2and51DF,p-value:
<
Valueoftest-statisticis:
Criticalvaluesforteststatistics:
1pct5pct10pct
tau2
phi1
>acf(h)
>pacf(h)
>ar=sarima(h,1,0,4,details=F)
>ar
$fit
Call:
stats:
:
arima(x=xdata,order=c(p,d,q),seasonal=list(order=c(P,D,
Q),period=S),xreg=xmean,=FALSE,=list(trace=trc,
REPORT=1,reltol=tol))
Coefficients:
ar1ma1ma2ma3ma4xmean
.
sigma^2estimatedas1850:
loglikelihood=,aic=
$degrees_of_freedom
[1]50
$ttable
EstimateSE
ar1
ma1
ma2
ma3
ma4
xmean
$AIC
[1]
$AICc
[1]
$BIC
[1]
>ma=sarima(h,0,1,1,details=F)
>ma
$fit
Call:
stats:
:
arima(x=xdata,order=c(p,d,q),seasonal=list(order=c(P,D,
Q),period=S),xreg=constant,=list(trace=trc,REPORT=1,
reltol=tol))
Coefficients:
ma1constant
.
sigma^2estimatedas3412:
loglikelihood=,aic=
$degrees_of_freedom
[1]53
$ttable
EstimateSE
ma1
constant
$AIC
[1]
$AICc
[1]
$BIC
[1]
>arma=sarima(h,1,1,1,details=F)
>arma
$fit
Call:
stats:
:
arima(x=xdata,order=c(p,d,q),seasonal=list(order=c(P,D,
Q),period=S),xreg=constant,=list(trace=trc,REPORT=1,
reltol=tol))
Coefficients:
ar1ma1constant
.
sigma^2estimatedas2548:
loglikelihood=,aic=
$degrees_of_freedom
[1]52
$ttable
EstimateSE
ar1
ma1
constant
$AIC
[1]
$AICc
[1]
$BIC
[1]
>res=residuals(ar$fit)
>(res)
Box-Piercetest
data:
res
X-squared=,df=1,p-value=
>plot(res*res)
>res<-residuals(ma$fit)
>res
TimeSeries:
Start=1
End=56
Frequency=1
[1]+01+01+01+00+00+00+01+01+02+01+00+01+01+01+01
[17]+01+01+01+01+01+00+00+02+02+02+01+01+01+01+01+01
[33]+01+01+00+01+01+01+01+01+01+00+01+01+02+02+01
[49]+01+01+01+01+02+01+01
>(res)#
Box-Piercetest
data:
res
X-squared=,df=1,p-value=
>yc=(h,10,1,1,1)
>yc$pred
TimeSeries:
Start=57
End=66
Frequency=1
[1]


- 配套讲稿:
如PPT文件的首页显示word图标,表示该PPT已包含配套word讲稿。双击word图标可打开word文档。
- 特殊限制:
部分文档作品中含有的国旗、国徽等图片,仅作为作品整体效果示例展示,禁止商用。设计者仅对作品中独创性部分享有著作权。
- 关 键 词:
- 语言 代码 试题答案 步骤
 冰点文库所有资源均是用户自行上传分享,仅供网友学习交流,未经上传用户书面授权,请勿作他用。
 整编新型生态农业旅游休闲农庄项目发展建设市场研究报告.docx
-
证券投资顾问业务暂行规定.docx
-
知识产权法司法考试历年真题及答案解析.docx
-
职业道德的复习重点.docx
-
志愿者活动心得精选多篇.docx
-
治理雾霾应重视大气静电学说.docx
-
中国成人脑死亡判定标准与操作规范第二版.docx
-
中国名牌产品申请表.docx
-
中国纸板产业深度调研及产业投资评估报告.docx
-
中考化学考点分类解析导学案14第3讲碳和碳的氧化物1碳单质的物理性质和用途.docx
-
中学学年度第二学期学校工作计划.docx
-
中英文安全标语word版本 26页.docx
-
重庆市高考英语试题.docx
-
注册安全工程师《安全生产管理知识》真题及答案.docx
-
装机必备硬件基础知识再接再厉完成装机.docx
-
子部.docx
-
总结范文骨干教师培训总结15篇.docx
-
最新 Marlin固件全中文解析.docx
-
最新部编版三年级语文上册第24课《司马光》教学设计.docx
-
最新二年级数学上册寒假作业全面系统146.docx
-
最新猴年祝贺词大全 精品.docx
-
最新入党思想报告3000字范文思想汇报文档五篇.docx
-
《OTL功率放大器的制作与调试》项目教学设计方案.docx
-
《化学方程式》单元检测2.docx
-
中考语文阅读精品题.docx
-
工伤司法鉴定标准是怎样的.docx
-
公共事务管理硕士在职专班入学研究计画书.docx
-
公考必备《行测》数量关系题库.docx
-
股票技术指标详解二.docx
-
人教版数学六下第二单元《百分数二》word教案精品教案.docx
-
简大型机房建设系统全套设计方案.docx
-
建筑工程基础加固与纠偏处理应用探讨.docx
-
Addis至Adama高速公路项目桥梁工程施工方案.docx
-
C618数控车床的主传动系统设计.docx
-
DIY电脑组装创业计划书范文.docx
-
Friends老友记第一季第01集It All Began.docx
-
javascript学习必须掌握的代码大全.docx
-
MATLAB绘图功能解决数学函数分析问题.docx
-
PEP小升初英语语法大全.docx
-
RAM Upgrades Parts and Procedures Notesdoc.docx
-
TSGZ0004基本要求.docx
-
VR常用参数.docx
-
XX地区民办养老养生休闲中心项目建设可行性研究报告.docx
-
社会工作法规与政策笔记考75分自我整理复习重点.docx
-
什么是DISC个性测验.docx
-
生物化学自学考试大纲.docx
-
十大营销经典案例.docx
-
实用XX乌黑鸡养殖及加工产业化项目可行性商业计划书.docx
-
三年级语文人教版第四单元测试题附答案.docx
-
事故隐患统计分析报告.docx
-
山东英才学院本科生毕业设计.docx
